$270K in One Week: Inside the Strategies of Polymarket's Top Crypto Traders
Polymarket is a prediction market platform where users trade outcome tokens on real-world events. Its 15-minute crypto markets run around the clock - a new “Will BTC go Up or Down?” every 15 minutes, across BTC, ETH, SOL, and XRP. They're fast, liquid, and unforgiving.
We analyzed 46,945 wallets and one week of on-chain fill data to find out who's actually making money in these markets, who's losing it, and what the sharpest wallets are doing differently.
The short answer: most people lose. But a small number of wallets are pulling out hundreds of thousands of dollars.
How 15-minute crypto markets work
Each market poses a simple binary question: “Will BTC go Up or Down in the next 15 minutes?” - that is, whether the coin's price at market close is higher or lower than at market open. Two outcome tokens - Up and Down - trade between $0.00 and $1.00, with prices reflecting the market's implied probability. When the 15 minutes are up, the winning token settles at $1.00 and the losing token at $0.00.
New markets launch every 15 minutes for four coins: BTC, ETH, SOL, and XRP. That's 96 markets per coin per day, or 384 total - generating a constant stream of short-duration trading opportunities.
The dataset
We pulled on-chain fills from Polymarket's exchange contracts on the Polygon blockchain for every resolved 15-minute crypto market from February 2–8, 2026. Each fill (a completed trade execution) records the maker (the wallet that posted a resting order), the taker (the wallet that filled it), the price, and the size - everything needed to compute PnL at the wallet level.
| Metric | Value |
|---|---|
| Markets analyzed | 2,688 (672 per coin) |
| On-chain fills | 15.3 million |
| Total volume (USDC, single-counted) | $153 million |
| Unique wallets | 46,945 |
| Avg fills per market | 5,711 |
| Avg volume per market | $56,763 |
Data sourced from Telonex's on-chain fills dataset. The full analysis notebook is available on GitHub if you want to reproduce or extend this work. This covers a single week - patterns may differ across longer timeframes or varying market conditions.
A note on fees: Our PnL calculations are pre-fee. Polymarket charges dynamic taker fees and offers maker rebates, neither of which are subtracted here. Real taker profitability is worse than shown throughout this article, and real maker profitability may be slightly better.
Only 37% of wallets made money
Out of 46,945 wallets that traded at least once, just 36.8% finished the week in profit. The median wallet PnL was roughly -$3 - barely negative, but firmly on the wrong side of zero. The majority of participants are small traders who churn through a handful of markets and come out a few dollars behind.
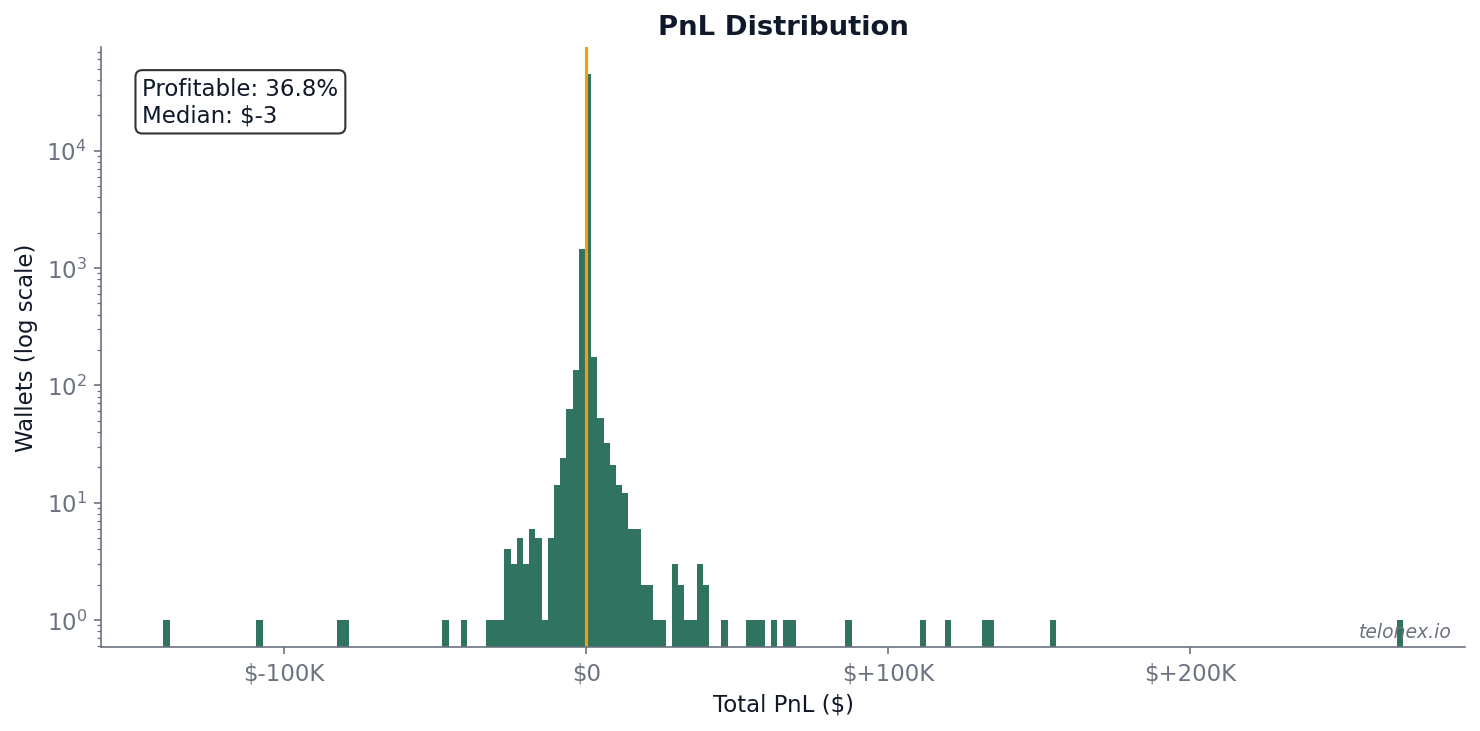
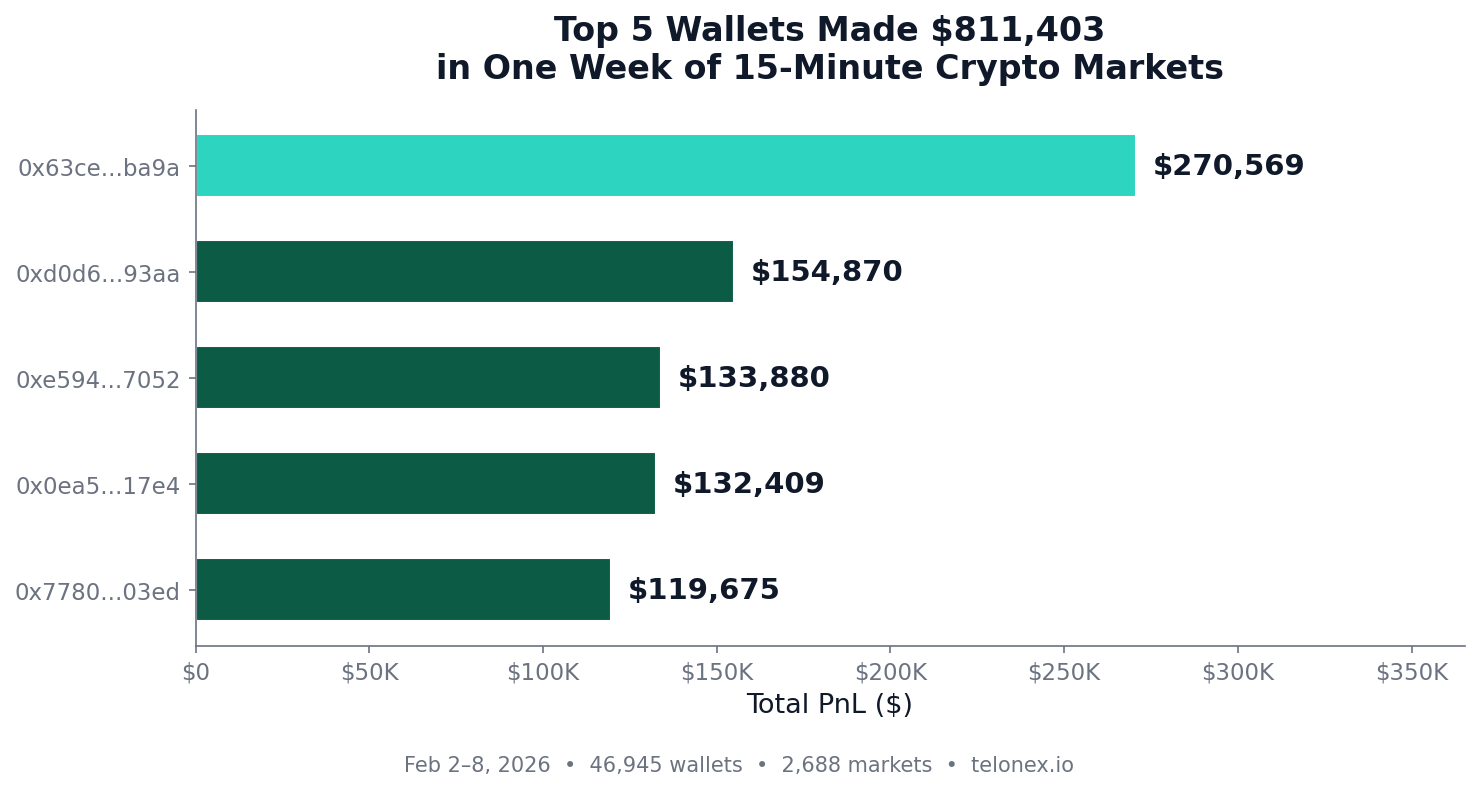
The distribution is heavily right-skewed: a few wallets captured enormous profits while the vast majority hovered near breakeven. The top wallet earned $270,569 in a single week. The top 5 wallets combined for $811,403.
On the other end, the biggest loser shed $139,971 - a majority-maker wallet that traded 142 markets and likely suffered from adverse selection.
Where the money flows
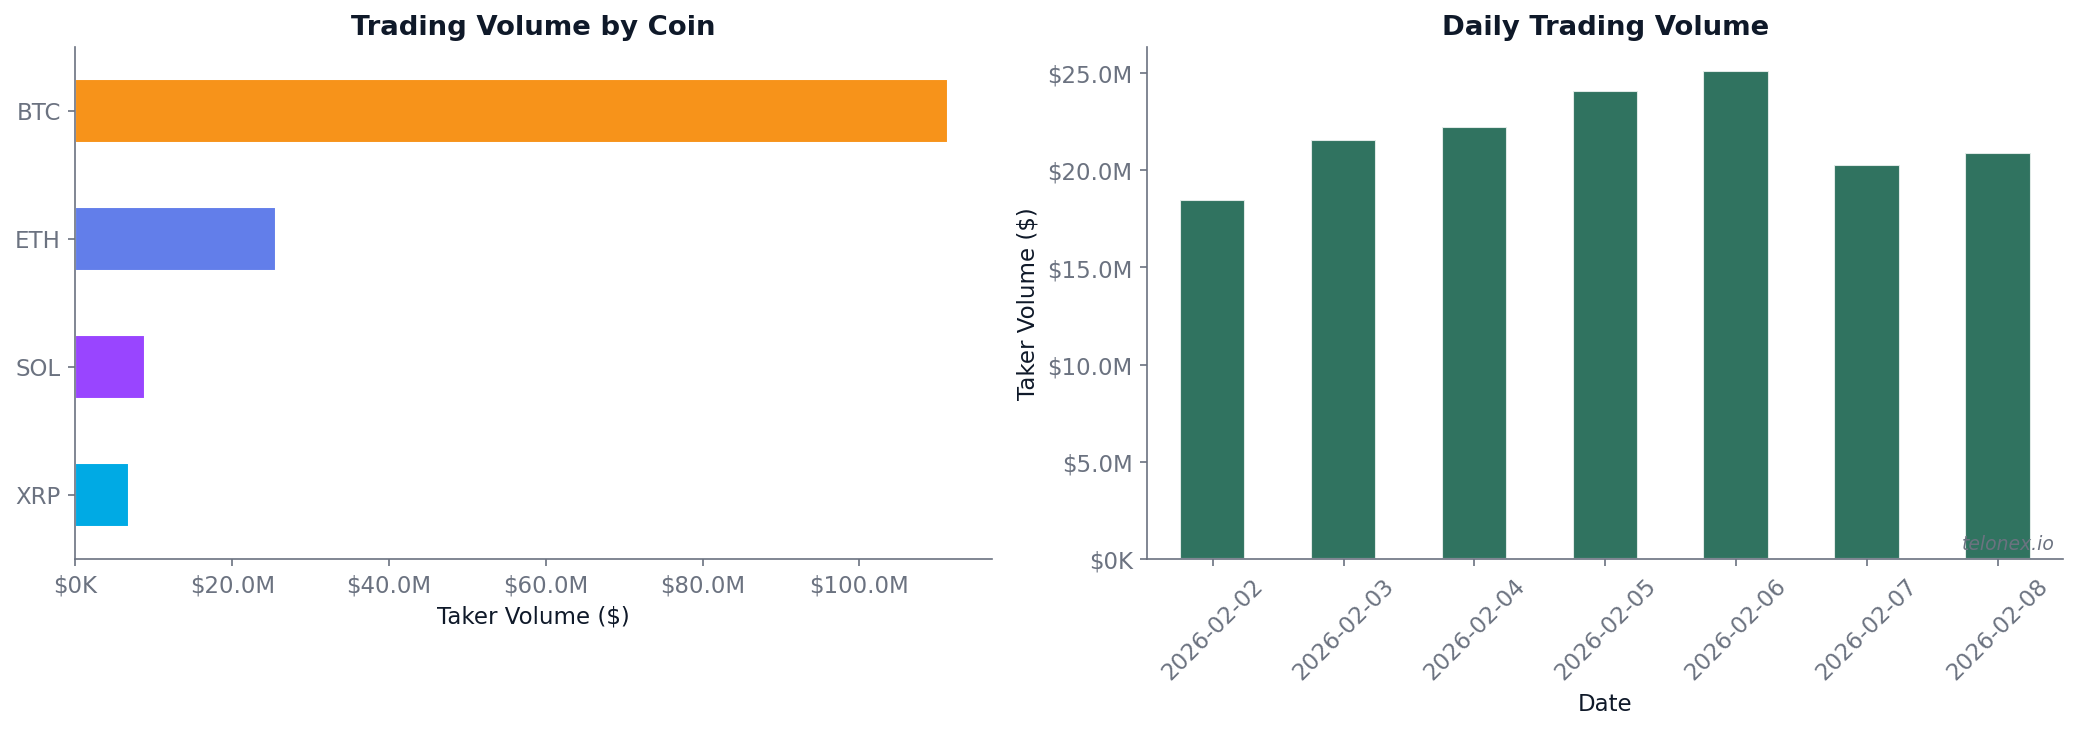
BTC dominates. Not only does it attract the most volume, but it's also the coin of choice for nearly every top wallet. 19 of the top 20 most profitable wallets list BTC as their primary coin. The BTC 15M markets are the most liquid, which makes them the natural home for both high-frequency market makers and large directional bets.
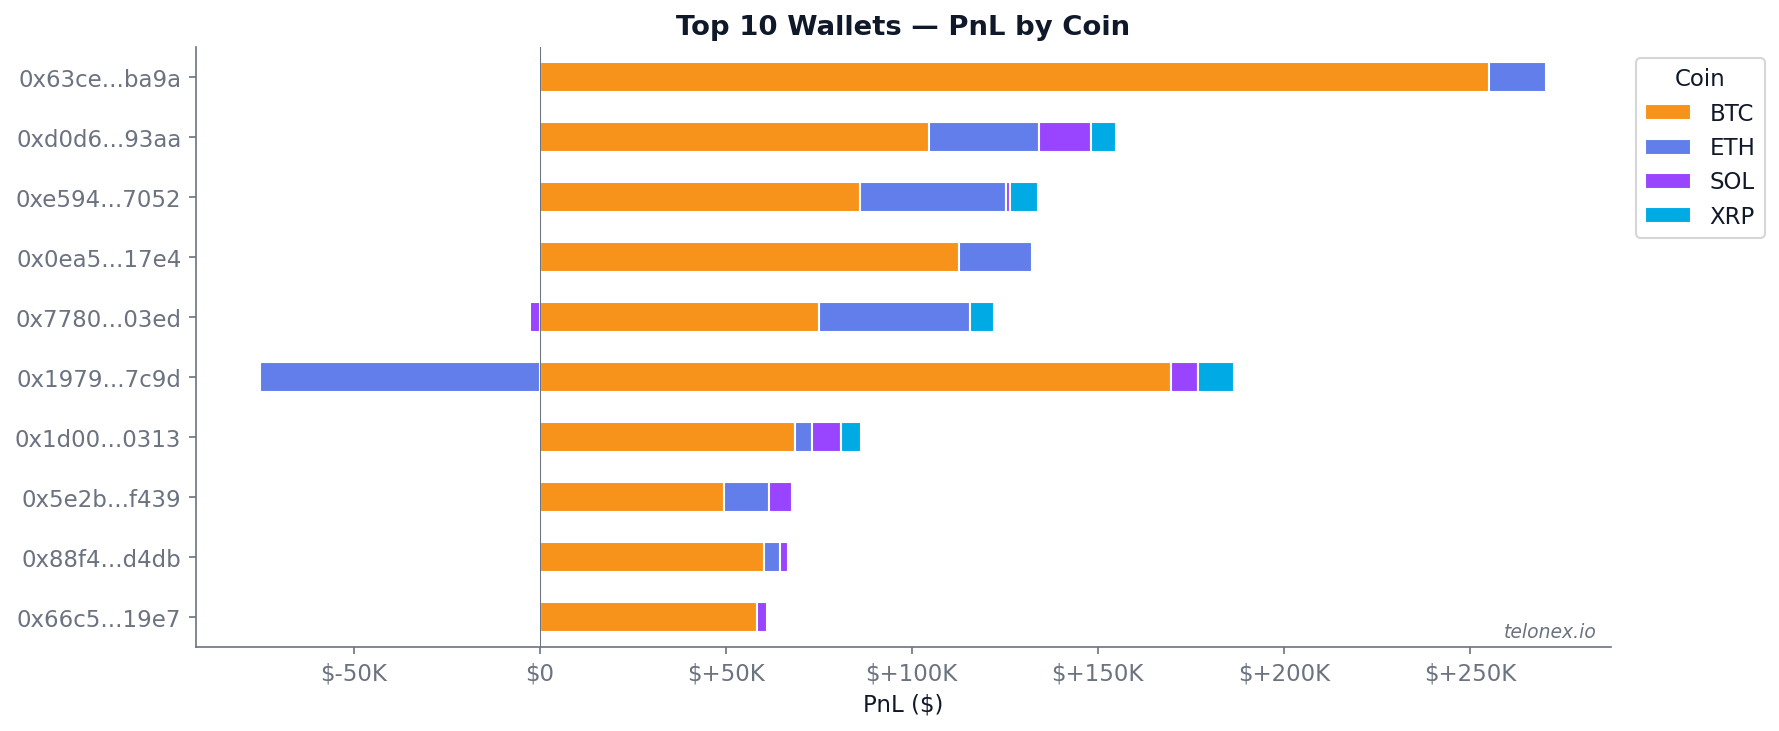
The per-wallet breakdown surfaces some nuance. While nearly all top-10 profits come from BTC, a few wallets show mixed results across coins - notably wallet 0x1979 (#6 by raw PnL, $111K total) which is net negative on ETH despite being solidly profitable overall.
Anatomy of a 15-minute market
Each market runs for exactly 15 minutes. We broke down fills and volume by minute (0 through 14) to see how trading activity distributes across the window.
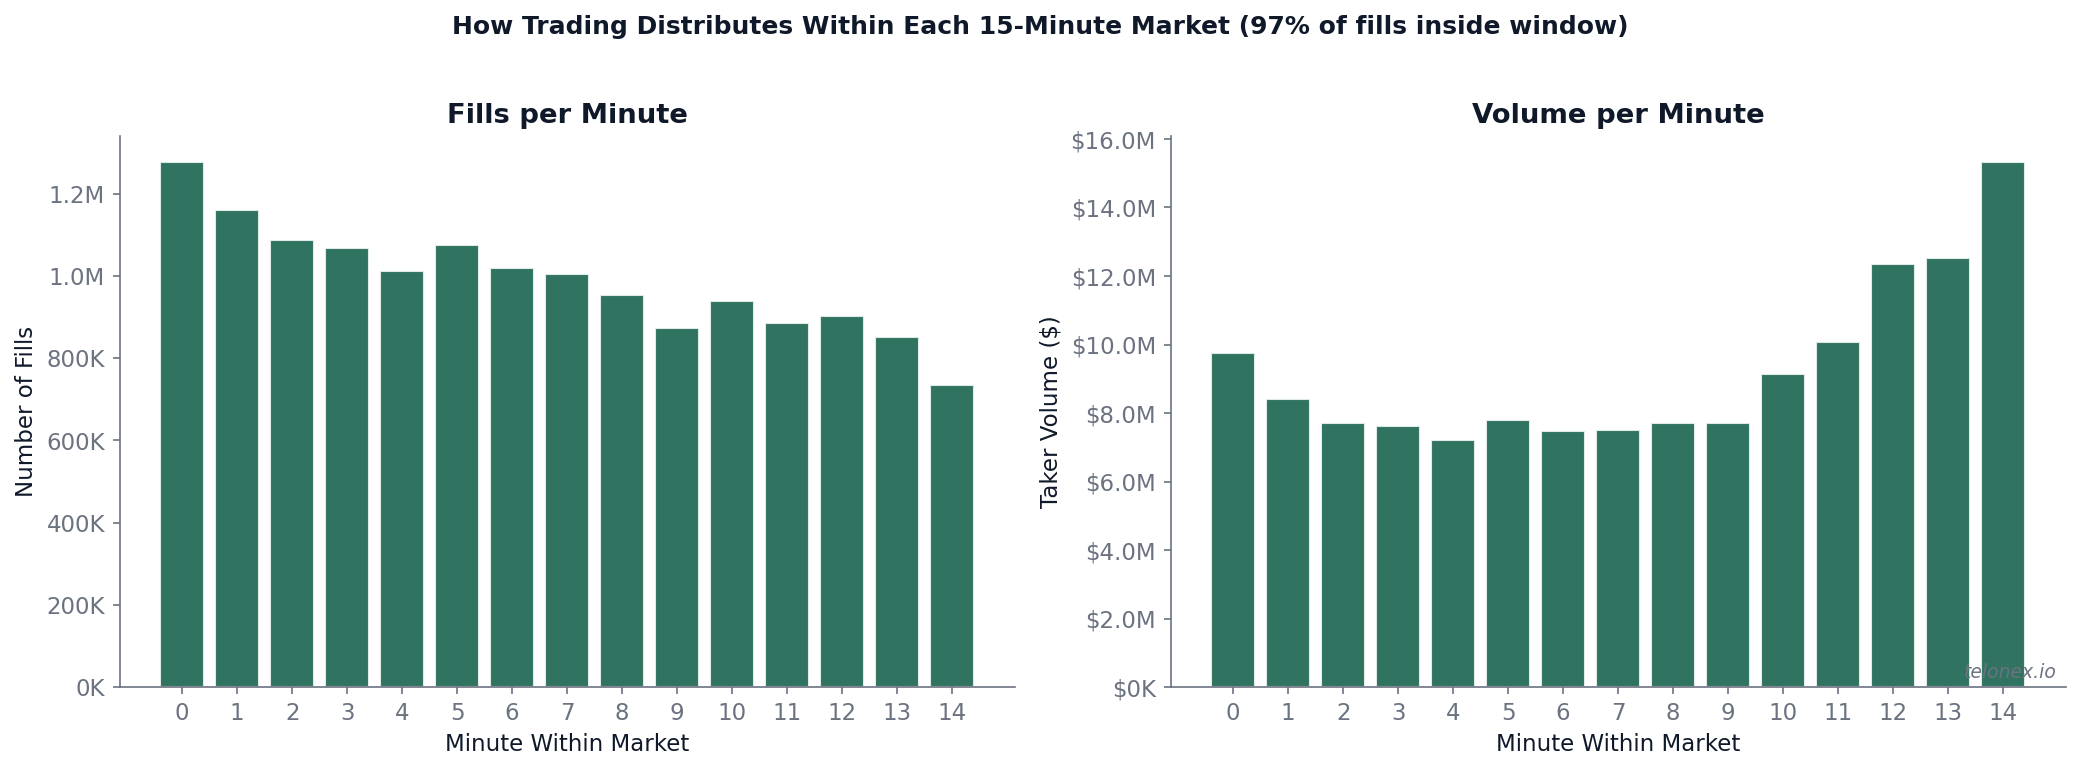
Fill count is highest at the open (minute 0) and steadily tapers off. But volume tells the opposite story - it spikes in the final minutes. The early minutes are price discovery: many small trades as the market finds its footing. The final minutes are conviction: fewer participants, but those who remain are placing larger bets at more extreme prices as the outcome becomes clearer.
Where does this late-stage volume concentrate in the price spectrum? You might expect the most action near the 50-cent line - the point of maximum uncertainty. Instead, volume is heavily concentrated at the extremes, near $0 and $1.
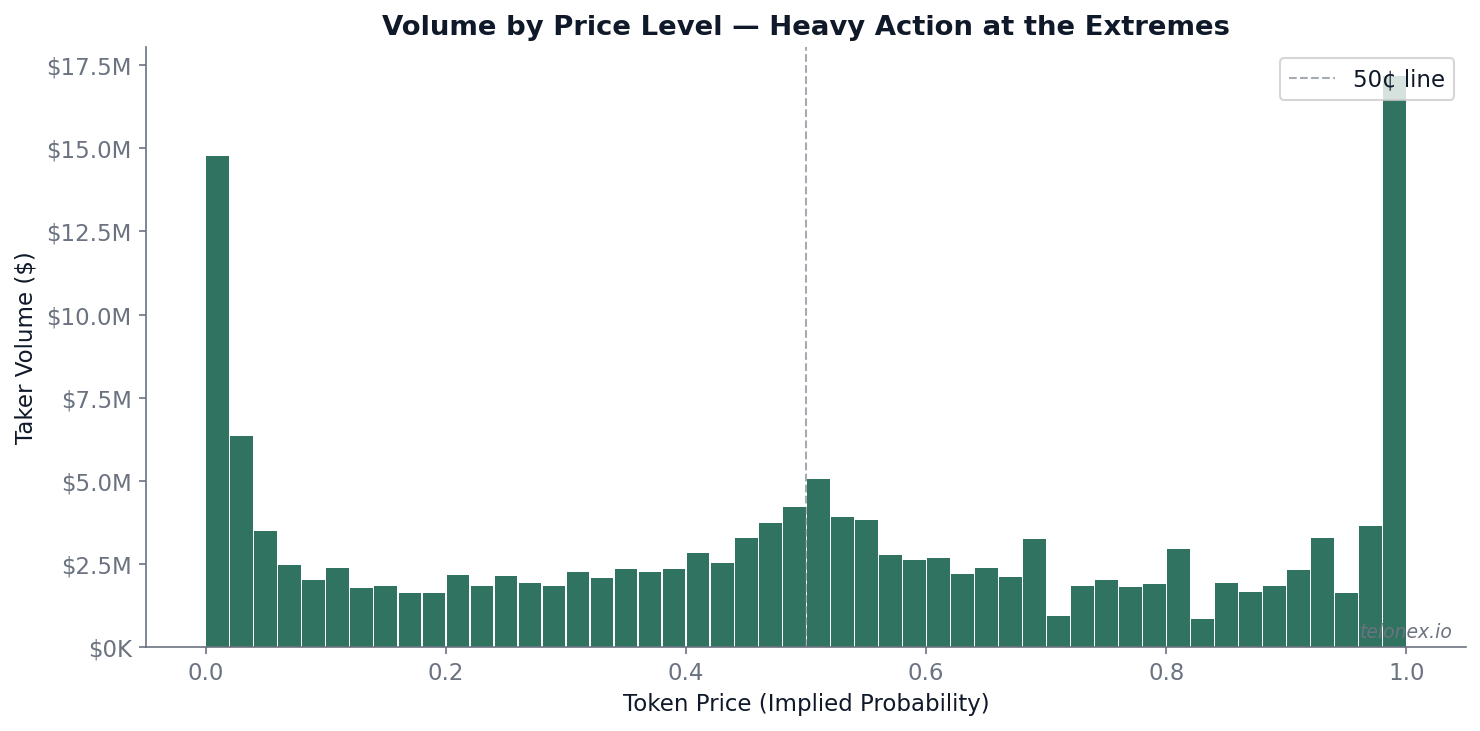
This makes sense given the market's lifecycle. As the 15-minute window progresses, the market prices in the likely outcome - pushing prices toward 0 or 1. The biggest bets happen late, when traders are confident they know which way BTC is heading.
For directional traders, this pattern matters. Early entries face more uncertainty and tighter prices. Late entries have better information but pay extreme prices - buying at $0.90 to win $1.00 means needing to be right far more often than wrong. That tension between timing and price leads to a counter-intuitive finding.
The maker-taker paradox
Takers come out ahead on 53% of individual trade executions but lose money overall. Meanwhile, makers win only 47% of individual fills but net +$728,501 for the week.
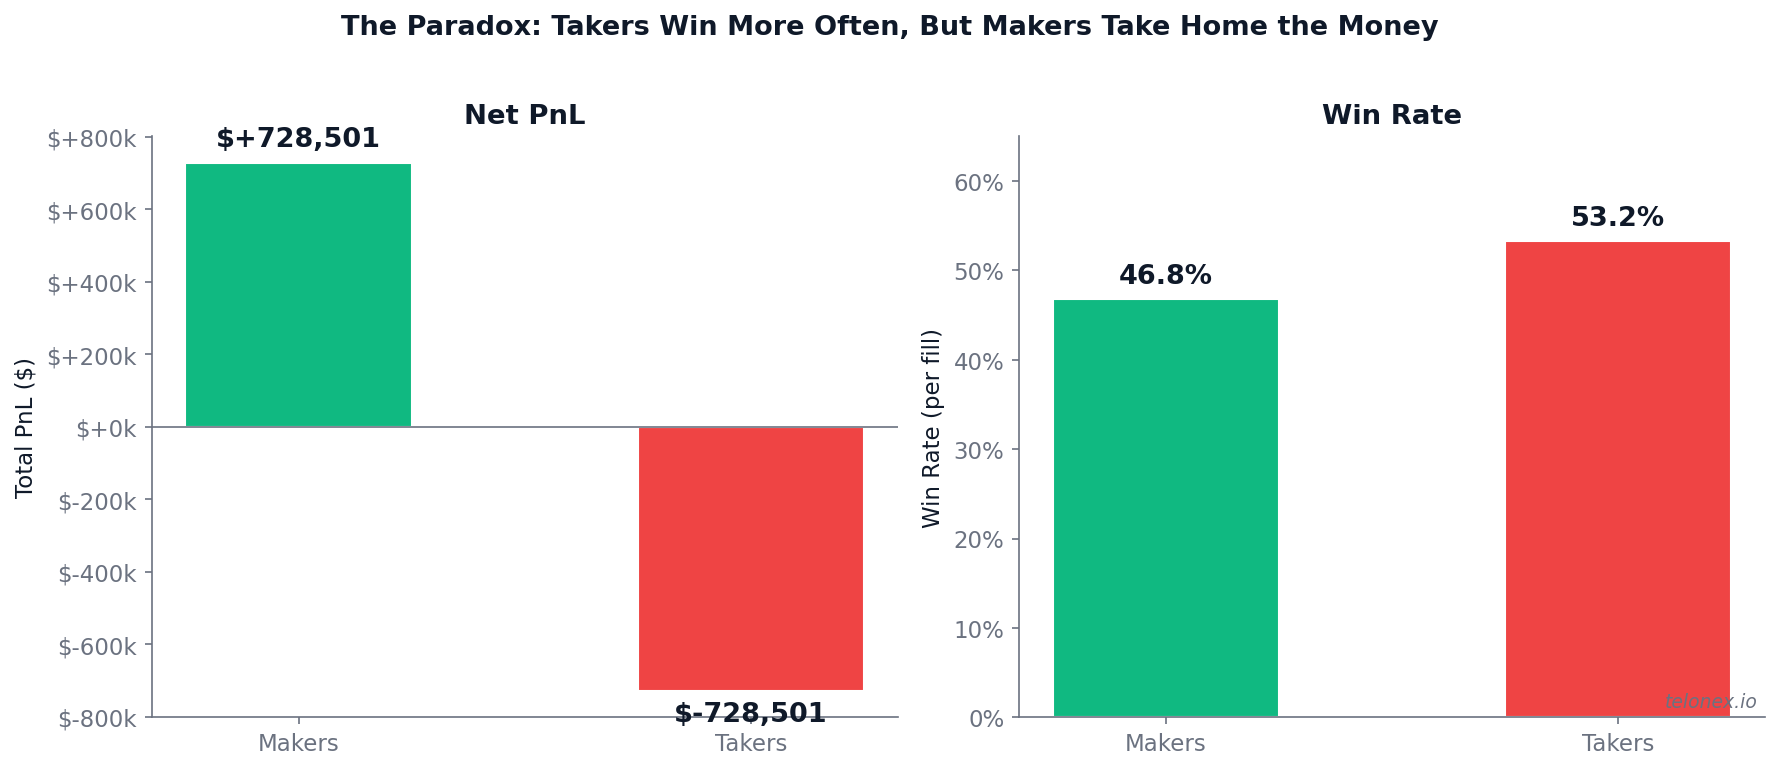
How? Makers earn the bid-ask spread on every trade. They post resting orders and collect a small edge when the market doesn't move against them. They lose more often - when the market moves and their quote gets filled at a stale price - but each loss is small and controlled.
Takers, on the other hand, “win” by picking the right direction more often. But they pay the spread on every fill. Each correct prediction earns a little, but the spread they pay on every execution silently erodes their edge until there's nothing left.
And remember: our PnL is pre-fee. Polymarket charges dynamic taker fees and offers maker rebates - after accounting for both, the taker disadvantage would be even more pronounced and the maker advantage even larger.
The takeaway for aspiring 15M traders: being right about direction isn't enough. How you execute - maker vs. taker, early vs. late, spread management - matters just as much as your prediction.
Trading efficiency: PnL per dollar traded
PnL tells you who made the most money. Another way to look at it: who's most efficient? We define Edge as PnL divided by volume - profit per dollar traded. We set a minimum of $10,000 in volume, leaving 2,565 eligible wallets.
| # | Wallet | Edge | PnL | Volume | Markets | Maker % |
|---|---|---|---|---|---|---|
| 1 | 0x5e2b...f439 | 155% | $67,708 | $43,659 | 8 | 25% |
| 2 | 0x7780...03ed | 137% | $119,675 | $87,260 | 11 | 47% |
| 3 | 0xdb21...39ff | 109% | $12,697 | $11,686 | 129 | 0% |
| 4 | 0x858c...a5a0 | 85% | $17,247 | $20,266 | 10 | 25% |
| 5 | 0xf800...24eb | 82% | $58,914 | $72,058 | 10 | 45% |
| 6 | 0x7163...a9e5 | 81% | $14,547 | $17,978 | 2,060 | 100% |
| 7 | 0xf49a...f9ba | 80% | $23,011 | $28,641 | 2,666 | 100% |
| 8 | 0x66c5...19e7 | 80% | $61,201 | $77,004 | 6 | 18% |
| 9 | 0x0e7d...c13a | 78% | $32,014 | $40,891 | 81 | 33% |
| 10 | 0xaf0f...d0f8 | 70% | $54,133 | $77,917 | 18 | 21% |
The top of the edge ranking is a mix of two very different archetypes:
Snipers - wallets like #1 and #2 that traded fewer than 15 markets with enormous PnL per trade. These wallets likely timed a few big bets perfectly, possibly using external price signals (like Binance spot price movements) to anticipate the outcome before the market prices it in. With so few markets, it's hard to distinguish genuine skill from a hot streak.
Market-making bots - wallets like #6 and #7 that show 100% maker ratio and traded 2,000+ markets. They're not predicting direction at all. They're quoting both sides of the book and collecting the spread across thousands of markets. Their edge (80%+) is consistent with tight spread management across thousands of markets rather than directional prediction.
The full top-20 PnL and edge tables are in the notebook.
Maker ratio vs. activity
Plotting each wallet's maker ratio (by USD volume) against its total number of fills reveals how different types of participants populate these markets:
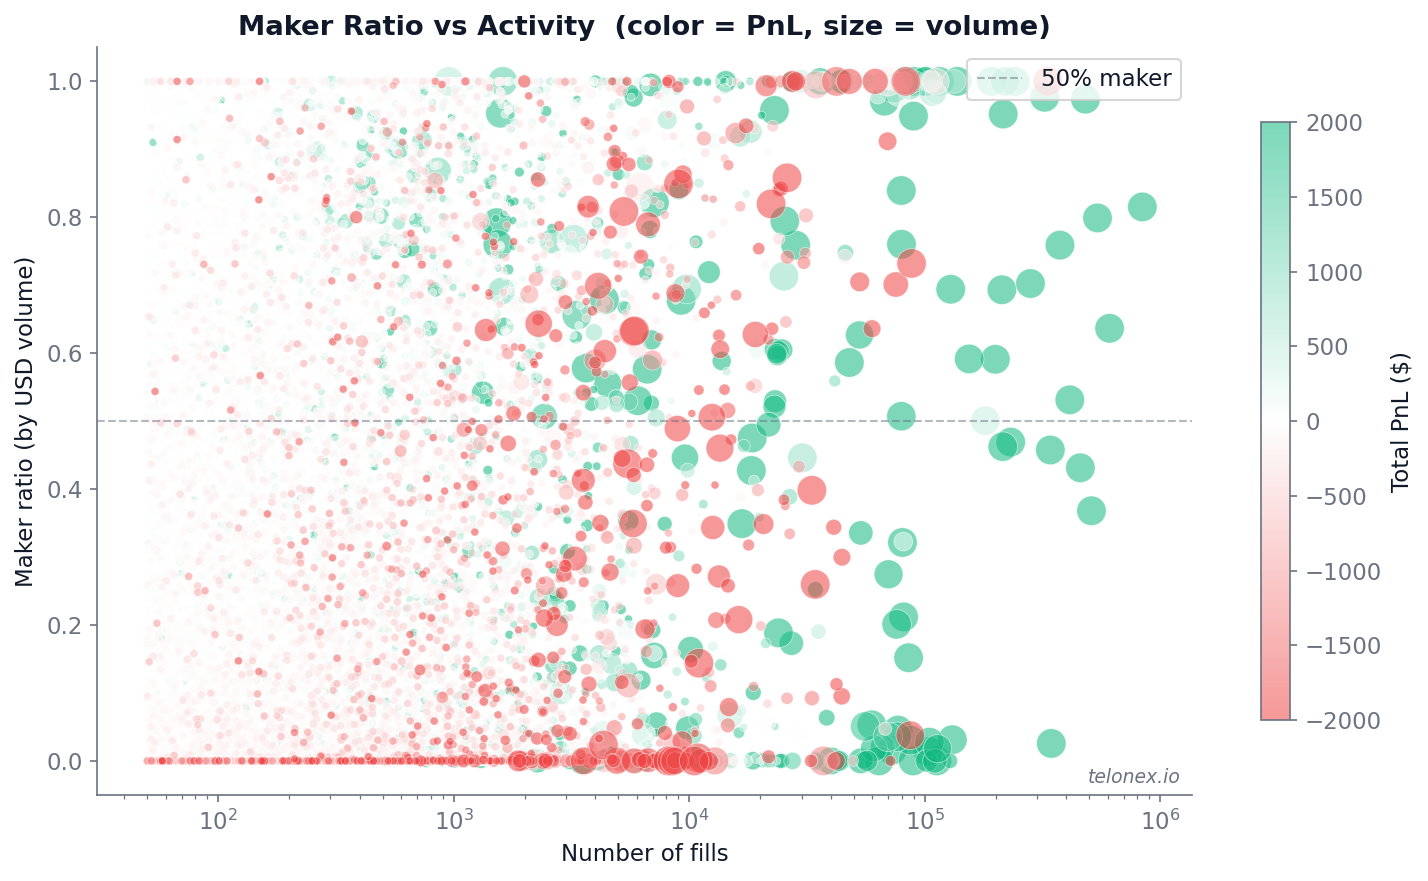
The most striking thing about this chart is that green dots appear across the entire maker-ratio spectrum. The snipers and market-making bots from the edge ranking are visible here, but so is everything in between. Pure takers near 0%, pure makers near 100%, and hybrids in the middle all produce profitable wallets. There is no single “correct” maker ratio - what matters is how well you execute your particular approach.
The companion charts below reinforce this:
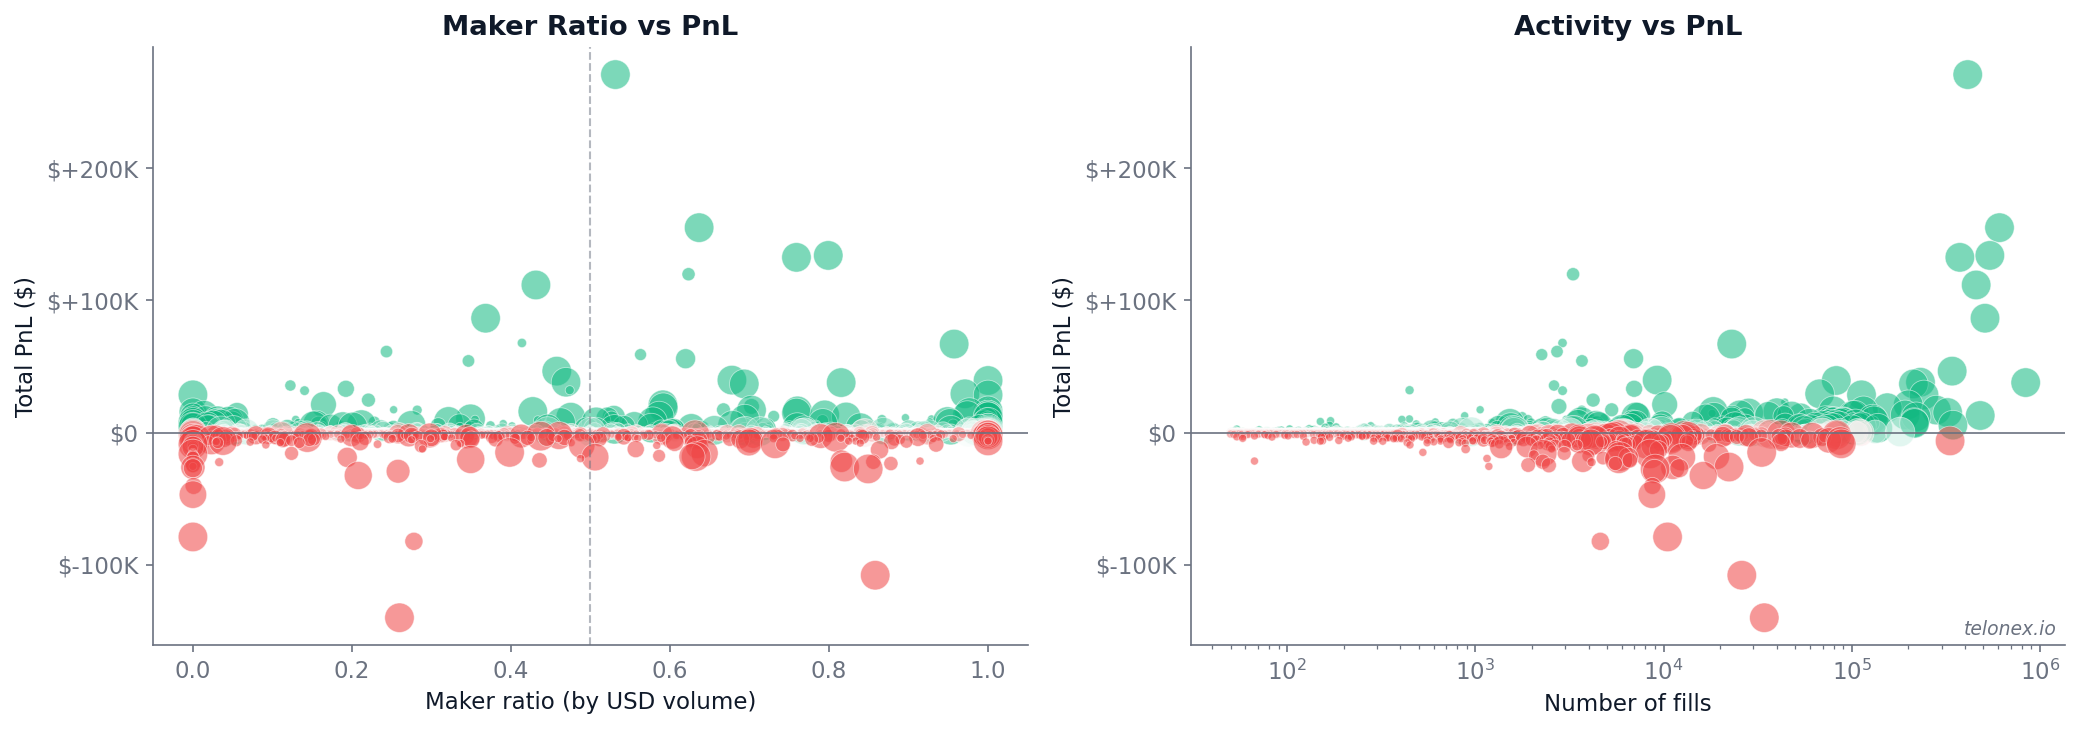
Maker ratio vs. PnL (left): Profitable wallets are scattered across every maker ratio. The top wallet ($270K) sits near 50% - a hybrid. Several wallets above 80% are solidly green (pure market makers). Others near 0% also made money (pure directional traders). The takeaway isn't that one ratio is better - it's that different strategies exploit different edges, and what matters is how well you execute your particular approach.
Activity vs. PnL (right): More fills means wider PnL dispersion in both directions. At the highest activity levels (100K+ fills), most wallets are green - these are sophisticated operations that have survived long enough to accumulate hundreds of thousands of fills. The deepest losses come from moderate-activity wallets, active enough to take real damage but without the edge or infrastructure to stay ahead.
When do the sharpest wallets trade?
The trading activity heatmap for the top 20 wallets reveals a surprising diversity of patterns:
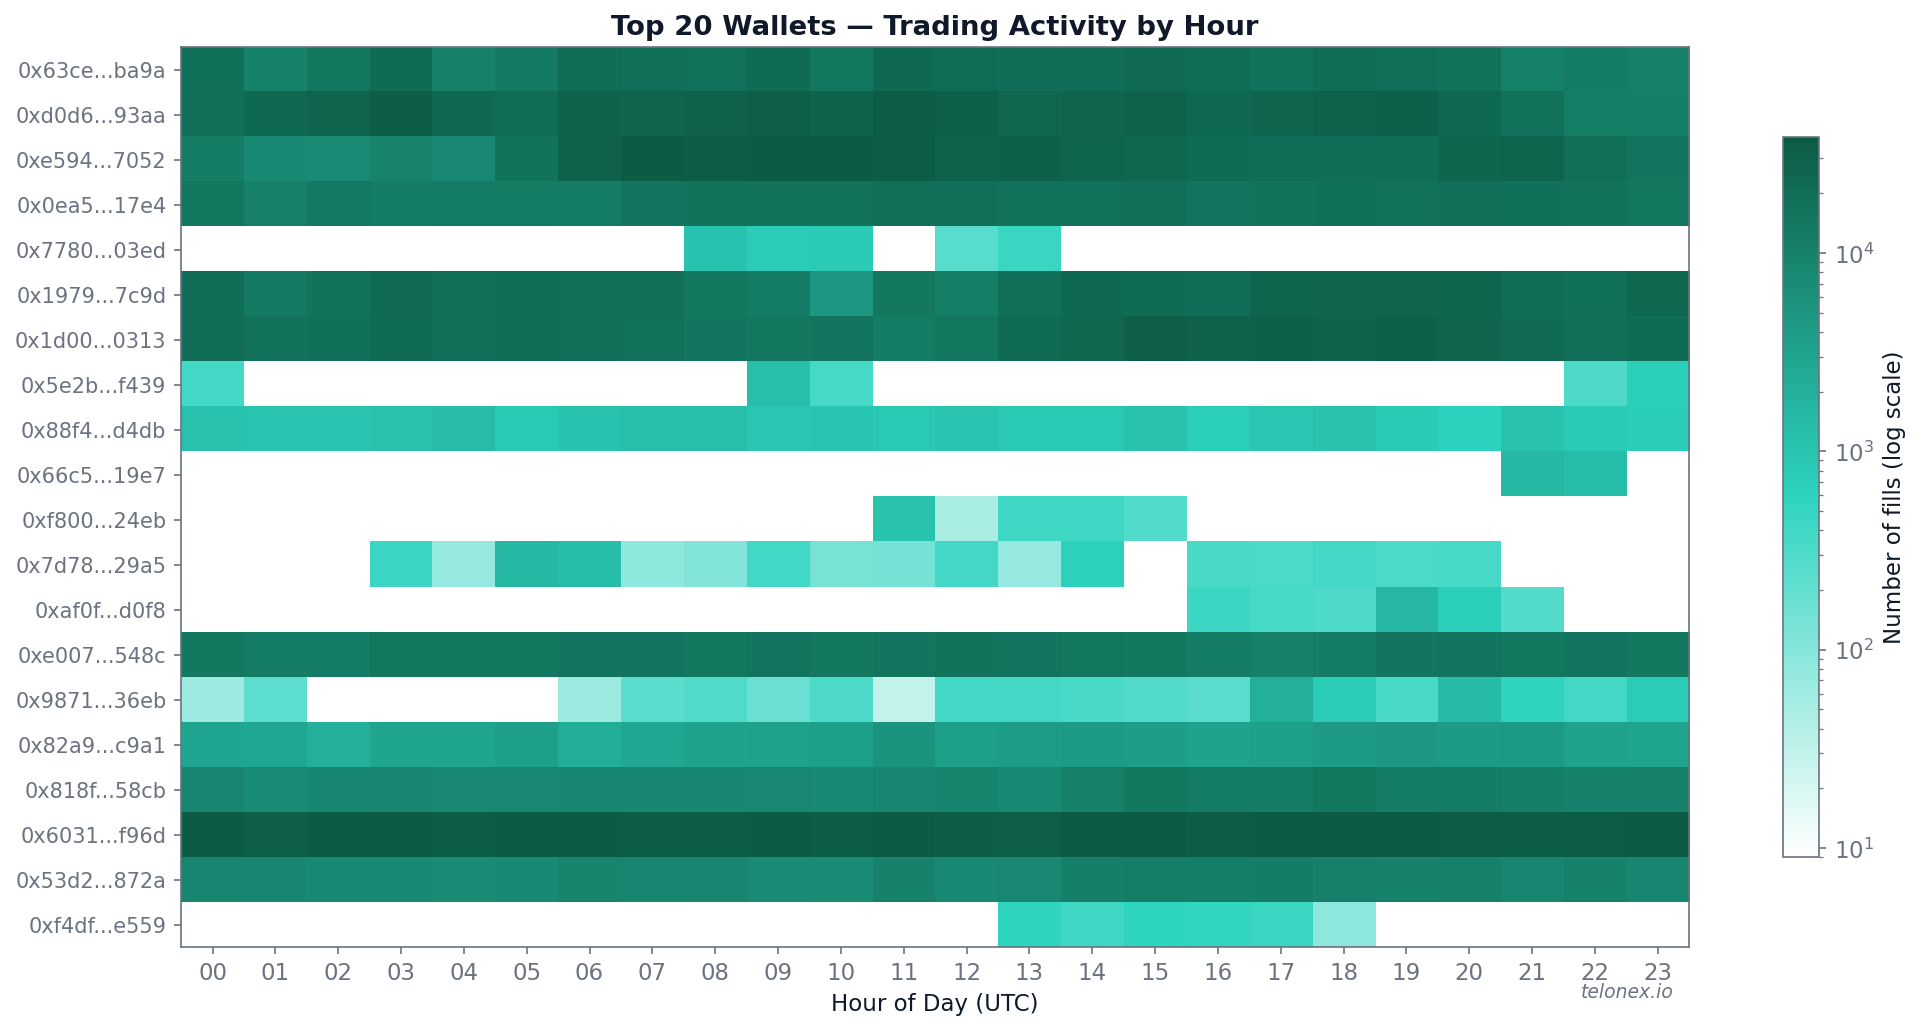
Some wallets show near-uniform activity across all 24 hours - almost certainly automated bots. Others cluster tightly in specific UTC windows, suggesting either human traders or bots tuned to specific trading sessions (e.g., US market hours, Asian hours).
This diversity matters because it means these markets aren't a homogeneous competition between identical bot strategies - they support genuine trading opportunities across multiple strategy types. Algorithmic market makers, manual speculators, and signal-driven bots all coexist and compete, each exploiting different edges at different times of day.
Future research
This analysis scratches the surface. The on-chain data contains far more signal than a single week-long overview can capture. Here are some threads we found interesting but didn't dig into - each could be its own deep-dive:
- Cross-token strategies. Wallet 0x1979 (#6 by raw PnL, $111K) trades all four coins but shows a net loss on ETH. Is it running a cross-token hedging strategy - going long BTC and short ETH simultaneously? Or is the ETH order book simply harder to make money in?
- Pure market maker mechanics. Several wallets in the edge ranking have 100% maker ratio (0x7163, 0xf49a). How tight are their spreads? How quickly do they update quotes? How do they manage inventory risk across thousands of consecutive 15-minute markets?
- Whale vs. sniper strategies. Wallet #1 by PnL (0x63ce, $270K) traded 1,168 markets with moderate size per trade. Wallet #5 by PnL (0x7780, $119K) traded just 11 markets with massive bets. Are the snipers timing entries based on external signals like Binance or Coinbase spot price feeds?
- Order flow toxicity. Which makers get adversely selected most often? Do certain taker wallets consistently pick off stale maker quotes right before price moves?
- Time-of-day alpha. Do certain wallets only trade during specific sessions? Is there a systematic edge at market open vs. close? The intra-market volume pattern (volume spiking at close) suggests there might be.
- Fee-adjusted profitability. After accounting for the taker fees and maker rebates mentioned above, how many wallets are truly profitable?
- Volatility effects. How does underlying crypto volatility affect profitability, volume, and the maker-taker balance? In high-vol periods, do makers get picked off more often? Do takers finally come out ahead? Correlating these stats with realized BTC volatility could reveal regime-dependent strategies.
- Inventory curves and risk management. How do top market makers manage their exposure within and across markets? By tracking a wallet's net position over time, you can reconstruct its inventory curve - revealing risk tolerances, how quickly they flatten exposure, and how long they hold directional risk before hedging or exiting. Do the best makers stay near-flat at all times, or do they tolerate significant inventory swings?
- Intra-market timing by wallet. Within each 15-minute window, when do specific wallets enter and exit? Some may favor the first few minutes (price discovery), others the final minutes (conviction bets at extreme prices). Mapping each wallet's preferred entry timing against their PnL could reveal whether early or late trading is systematically more profitable.
Methodology
We used the Telonex on-chain fills dataset, which contains every trade fill recorded on Polymarket's exchange contracts on Polygon. For each fill, we computed PnL based on the trade price, side (buy/sell), and the market's final settlement outcome. PnL is zero-sum across all participants by construction - every dollar gained by one wallet is lost by another. All timestamps are on-chain block timestamps. Volume figures are single-counted (taker side only). PnL is pre-fee. Note that a single entity may control multiple wallets - we treat each wallet address independently.
Every data point in this article came from Telonex's on-chain fills dataset. The wallets, the strategies, the edges - they're all queryable.
- Full notebook on GitHub - all code, charts, and data queries are reproducible
- Sign up for Telonex - free tier to get started
- Telonex documentation - dataset schemas, SDK reference, and API docs