How Sponsored Liquidity Rewards Rewired Polymarket's Jesus Market
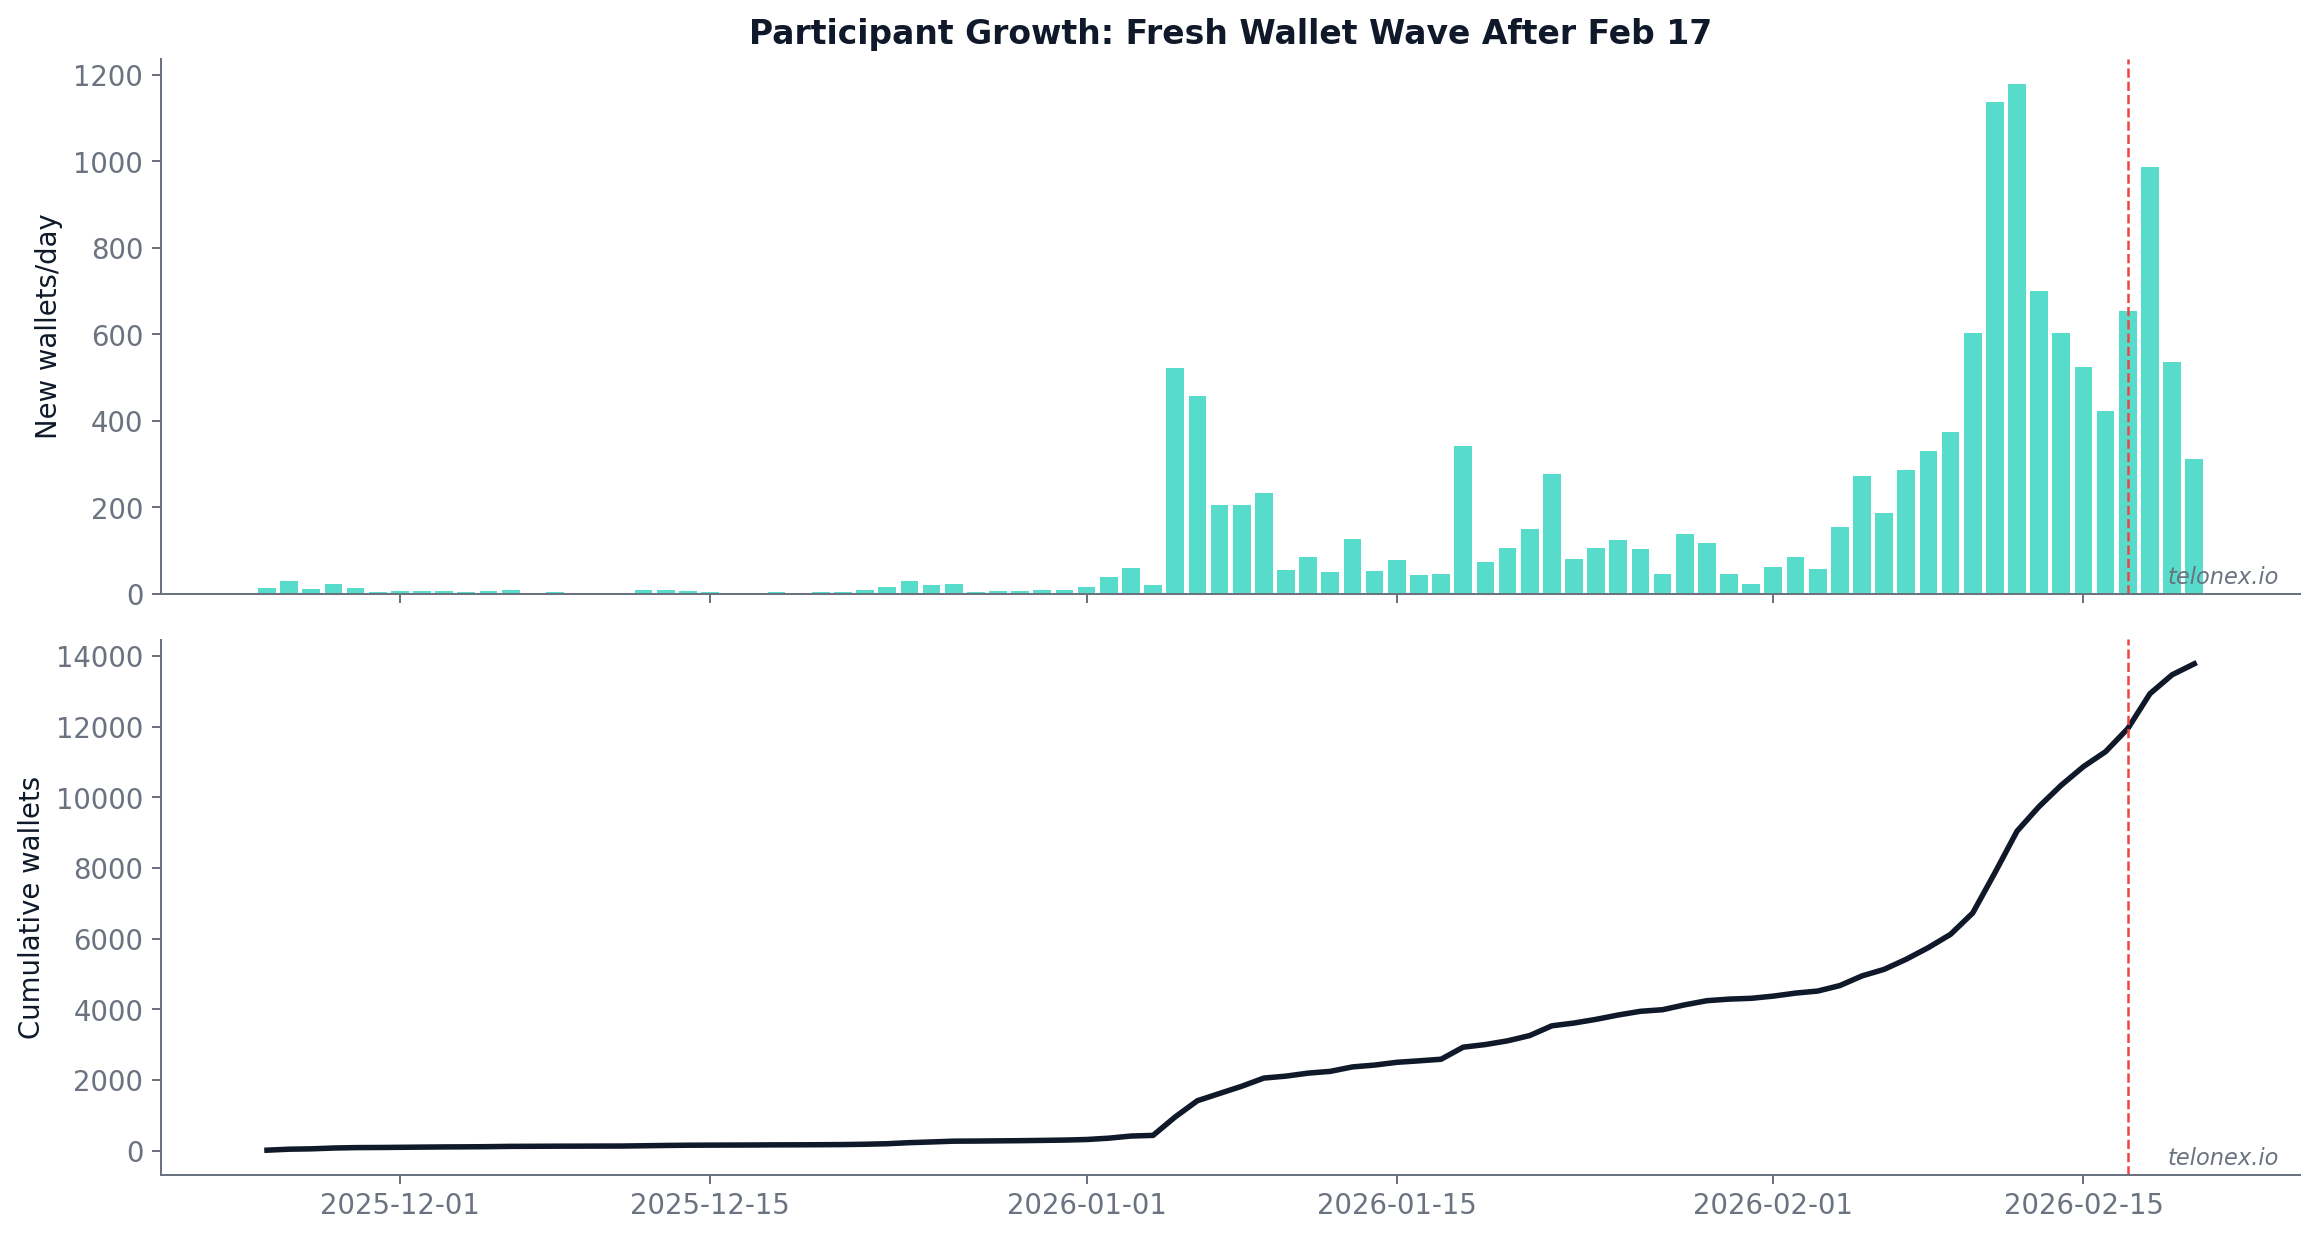
Polymarket's Will Jesus Christ return before 2027? market has been one of the platform's most viral moments. Nearly 14,000 wallets traded it and over $11.5 million in volume flowed through the book.
Then on February 17, 2026, someone added roughly $70,000 in sponsored liquidity rewards to the market. Within seconds, the orderbook transformed. Market makers flooded in, depth exploded, and the cost of moving the price became an order of magnitude higher.
This is a tick-level case study of what happened before, during, and after that moment - using on-chain fills (Nov 25, 2025 - Feb 20, 2026) and CLOB data including trades, quotes, and 25-level orderbook snapshots (Jan 19 - Feb 20, 2026). It's also the clearest real-time demonstration we've seen of how Polymarket's sponsored rewards program can reshape a market's microstructure.
A market unlike any other
Before we get to the sponsorship event, it's worth understanding what made this market unusual in the first place.
Most prediction markets are driven by information - polling data, earnings reports, court rulings. The Jesus market is driven by conviction. There is no new “data” arriving to update priors. Instead, you have a large population of wallets expressing a view on something unfalsifiable within the market's timeframe, and an even larger population betting against them.
The numbers reflect this asymmetry: 8,648 wallets held net-short positions (betting NO) versus just 1,522 net-long (betting YES) - a 5.68-to-1 skeptic-to-believer ratio. The top 4 long holders alone controlled 71.8% of all net-long YES inventory. Belief was concentrated; skepticism was distributed.
Volume growth was explosive. From November 2025 to February 2026, monthly gross taker-paid on-chain volume expanded 2,018x. Much of this was driven by a single event on February 1: one wallet (0x98e9...ed64) executed three transactions that accounted for 98.8% of YES taker-buy shares that day - a concentrated bet that briefly pushed the price upward and drew waves of new participants into the market.
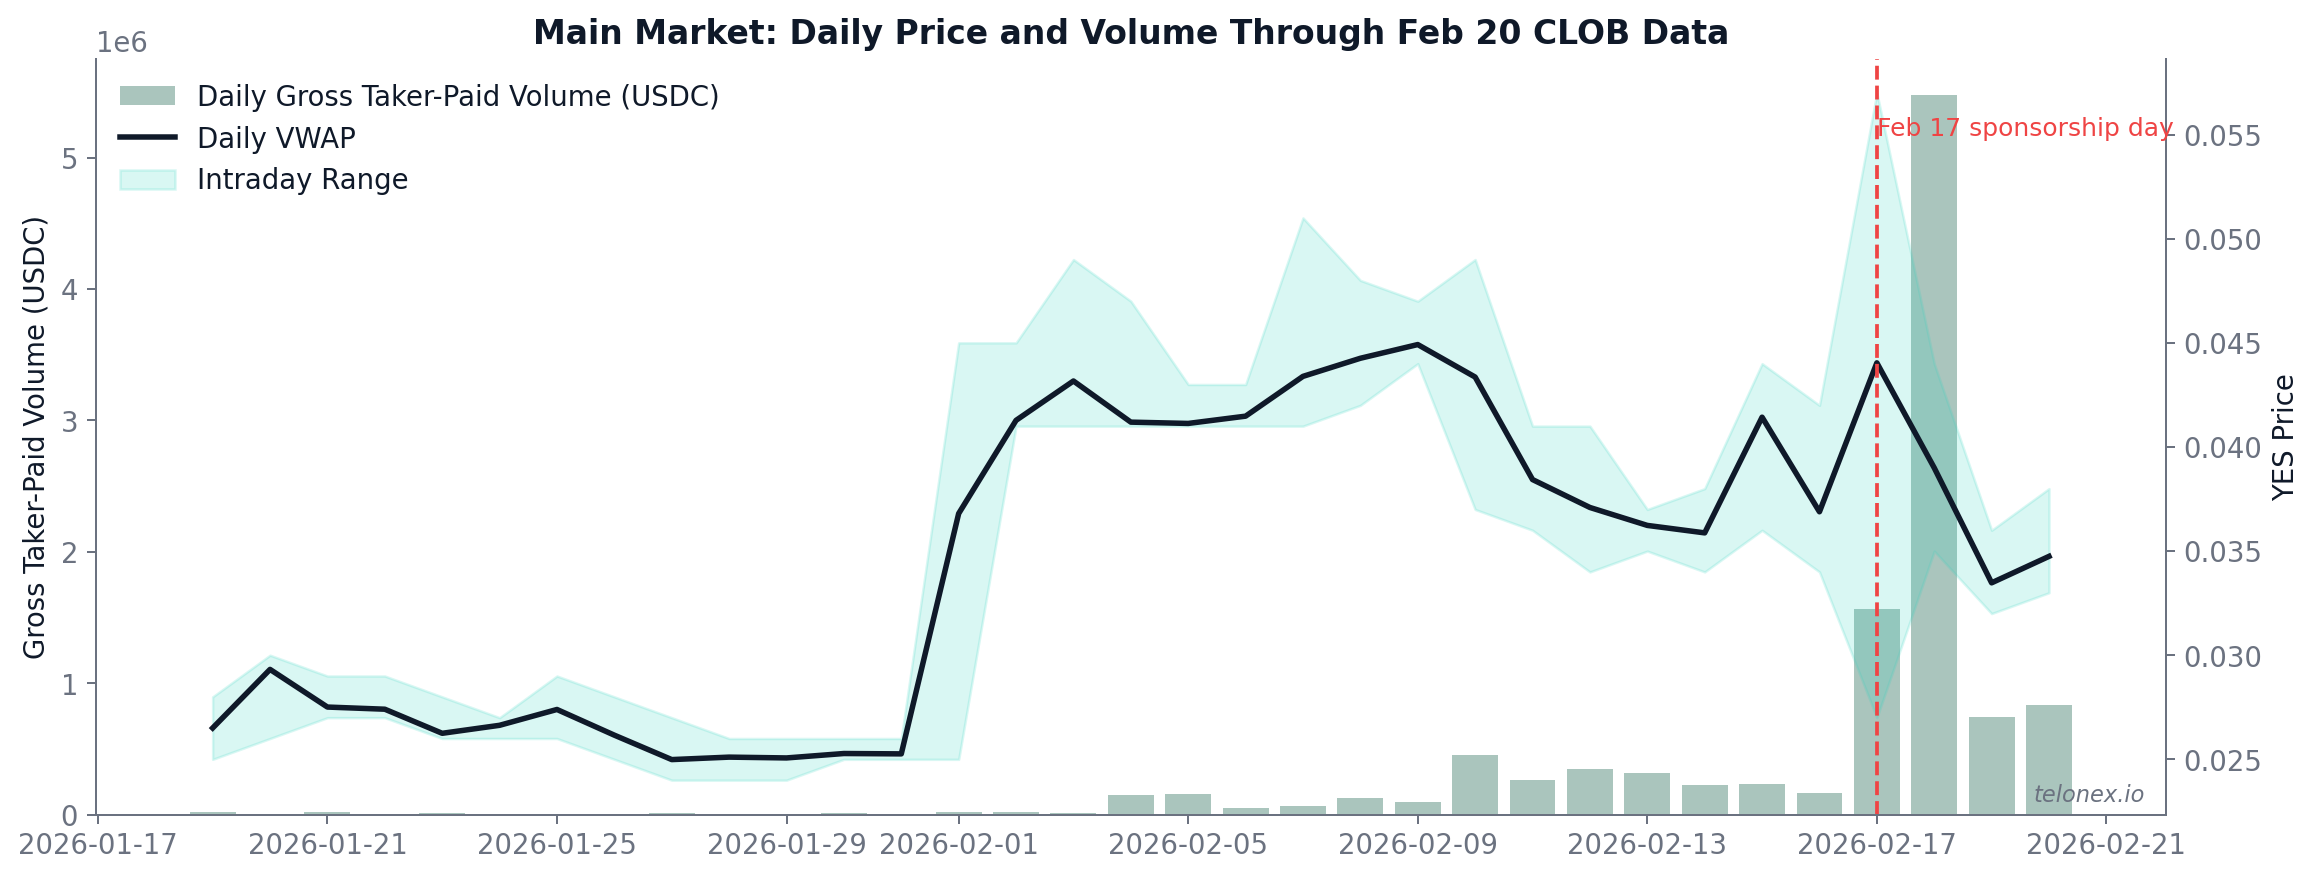
By mid-February, the market was liquid by viral-market standards - but the book was thin. Spreads sat near the tick floor, which sounds good until you realize that the depth behind those quotes was shallow. Anyone trying to execute a meaningful-sized order would move the price significantly. The market had attention. What it lacked was capacity.
February 17: the regime break
Polymarket's sponsored liquidity rewards program lets anyone subsidize market making on a specific market. Sponsors deposit funds, and Polymarket's reward algorithm distributes them to makers proportional to how much depth they provide, how tight their spreads are, and how long they stay quoted.
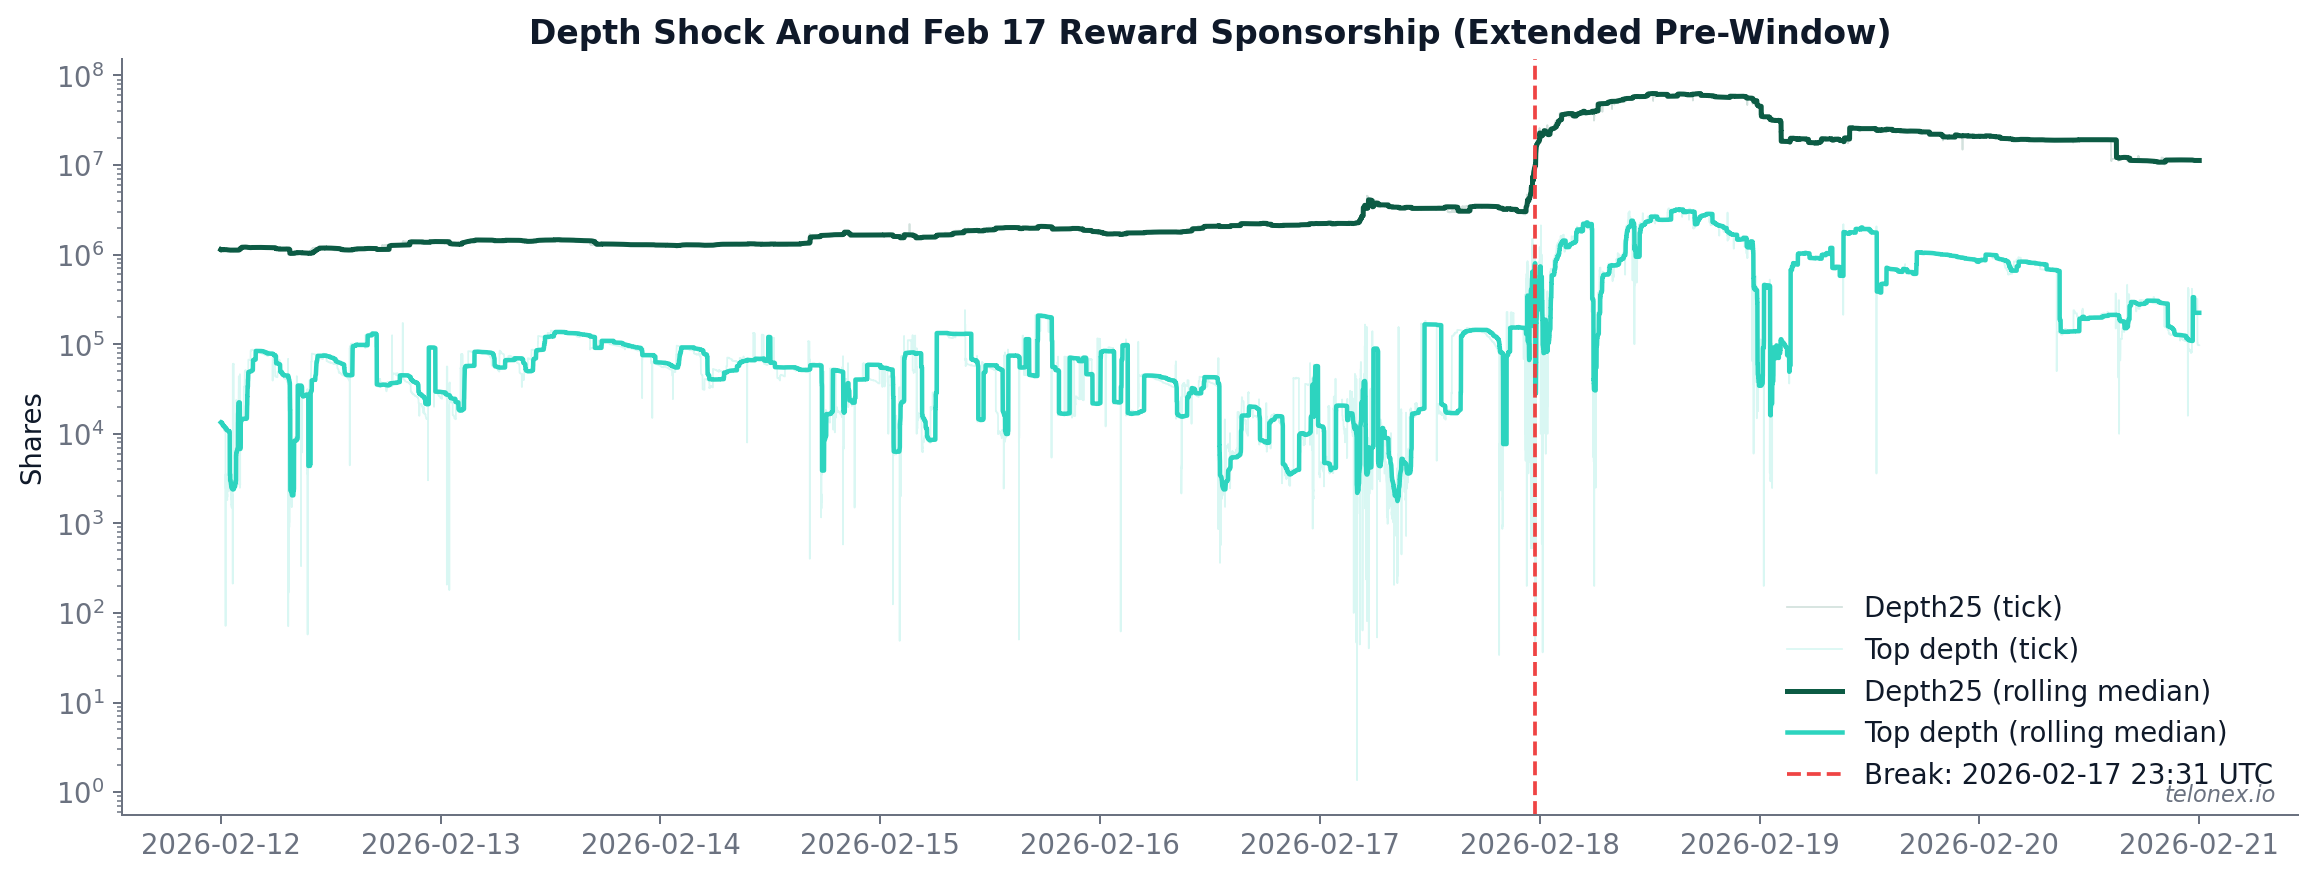
On February 17, a sponsor added approximately $70,000 in rewards to the Jesus market. Polymarket's algorithm distributes rewards continuously based on quoting activity. The effect was not gradual. Using tick-to-tick depth data, we can see a sharp structural break late on Feb 17 UTC - the book went from thin to thick within minutes. The transition looked less like organic growth and more like a switch being flipped: makers saw the new incentive and started competing to post size.
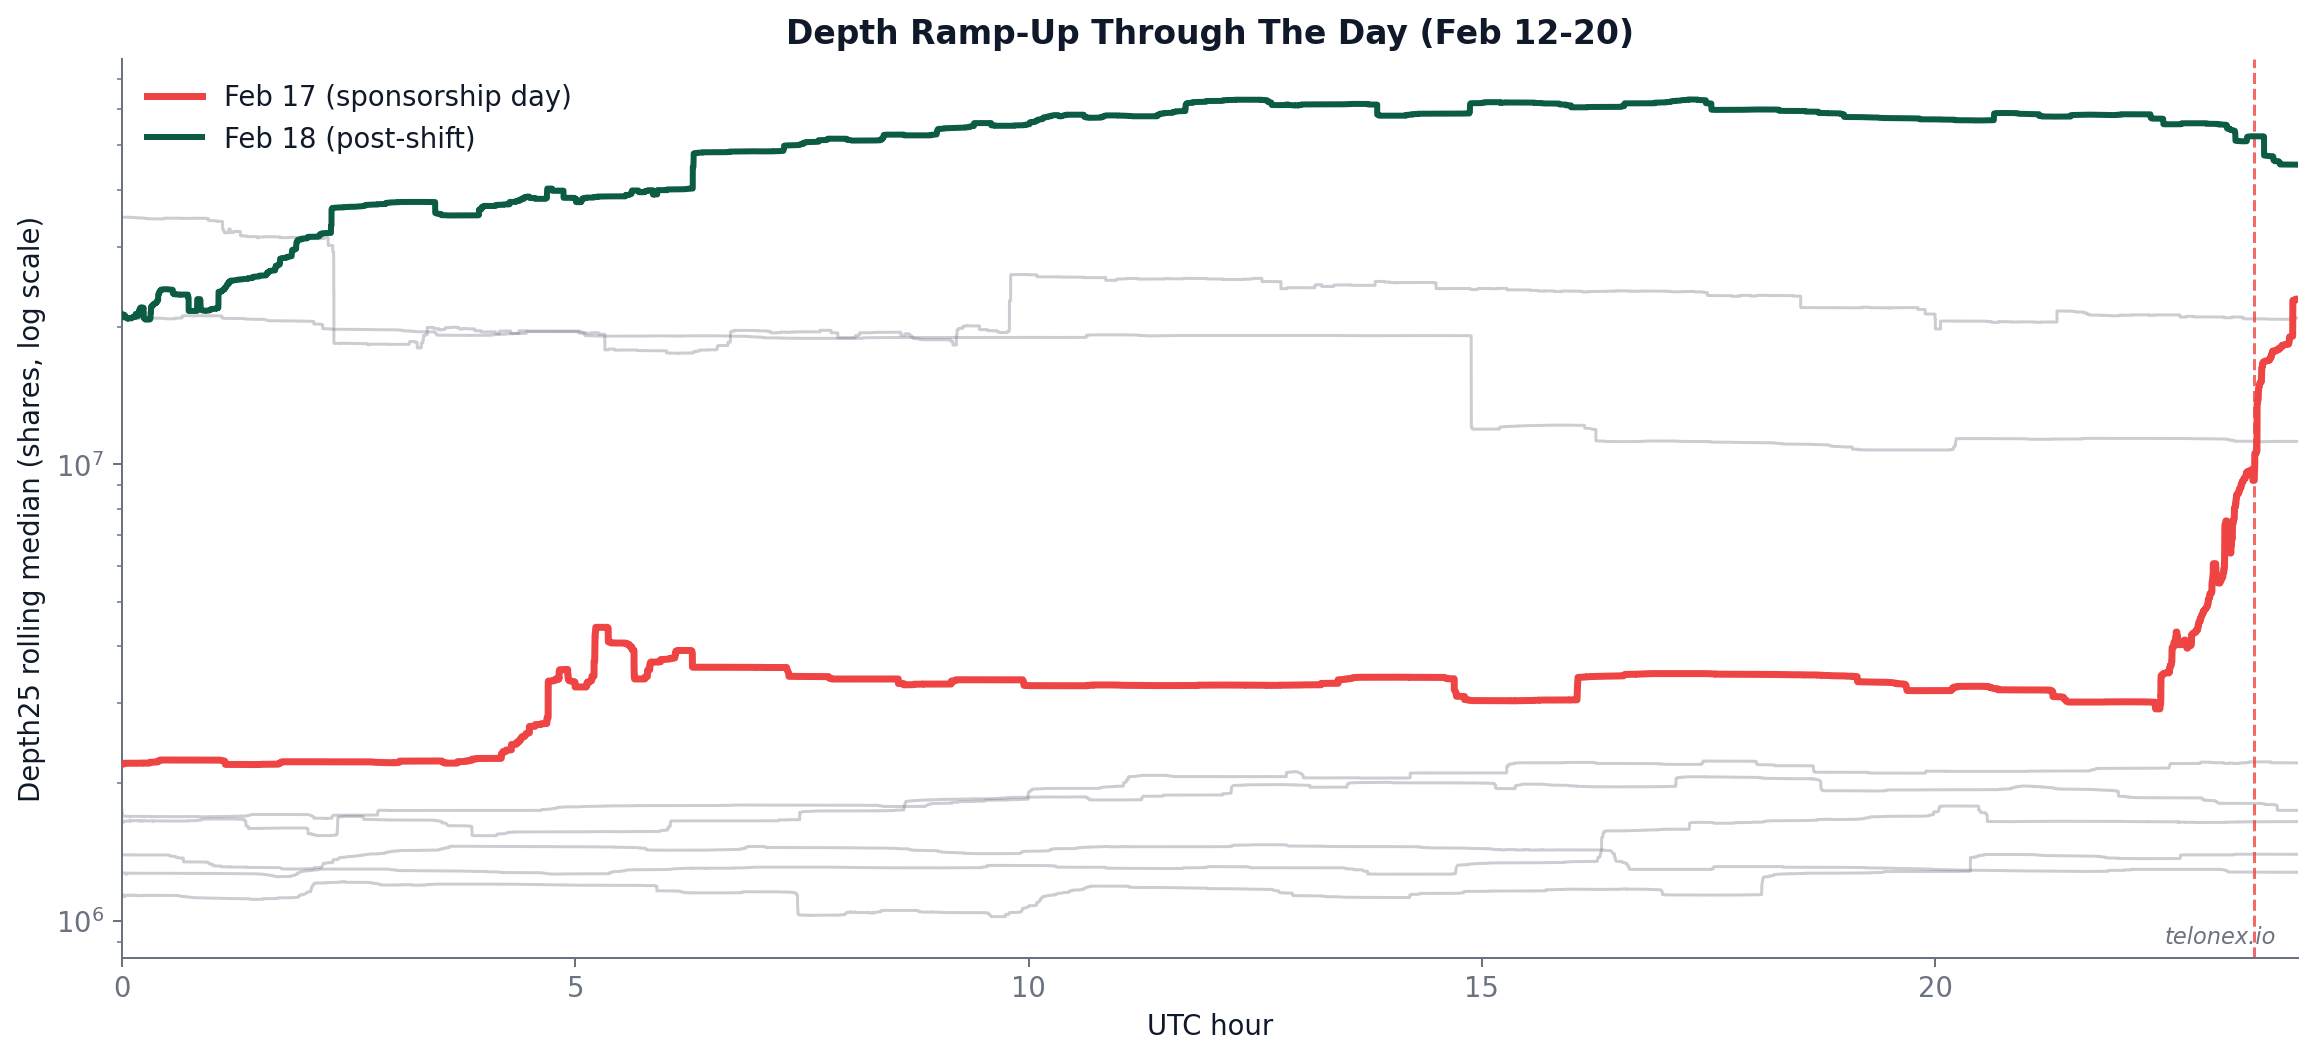
The depth ramp-up chart below makes this even more vivid. Each line traces total orderbook depth through the hours of a single day, from February 12 to February 20. The red line is February 17: flat all day, then a sudden vertical spike at the far right when rewards hit. The green line is February 18, the first full post-reward day - it opens at the new elevated regime and stays there. The gray lines are the remaining days in the window; notice that the gray lines running along the top are Feb 19-20, confirming the new regime held.
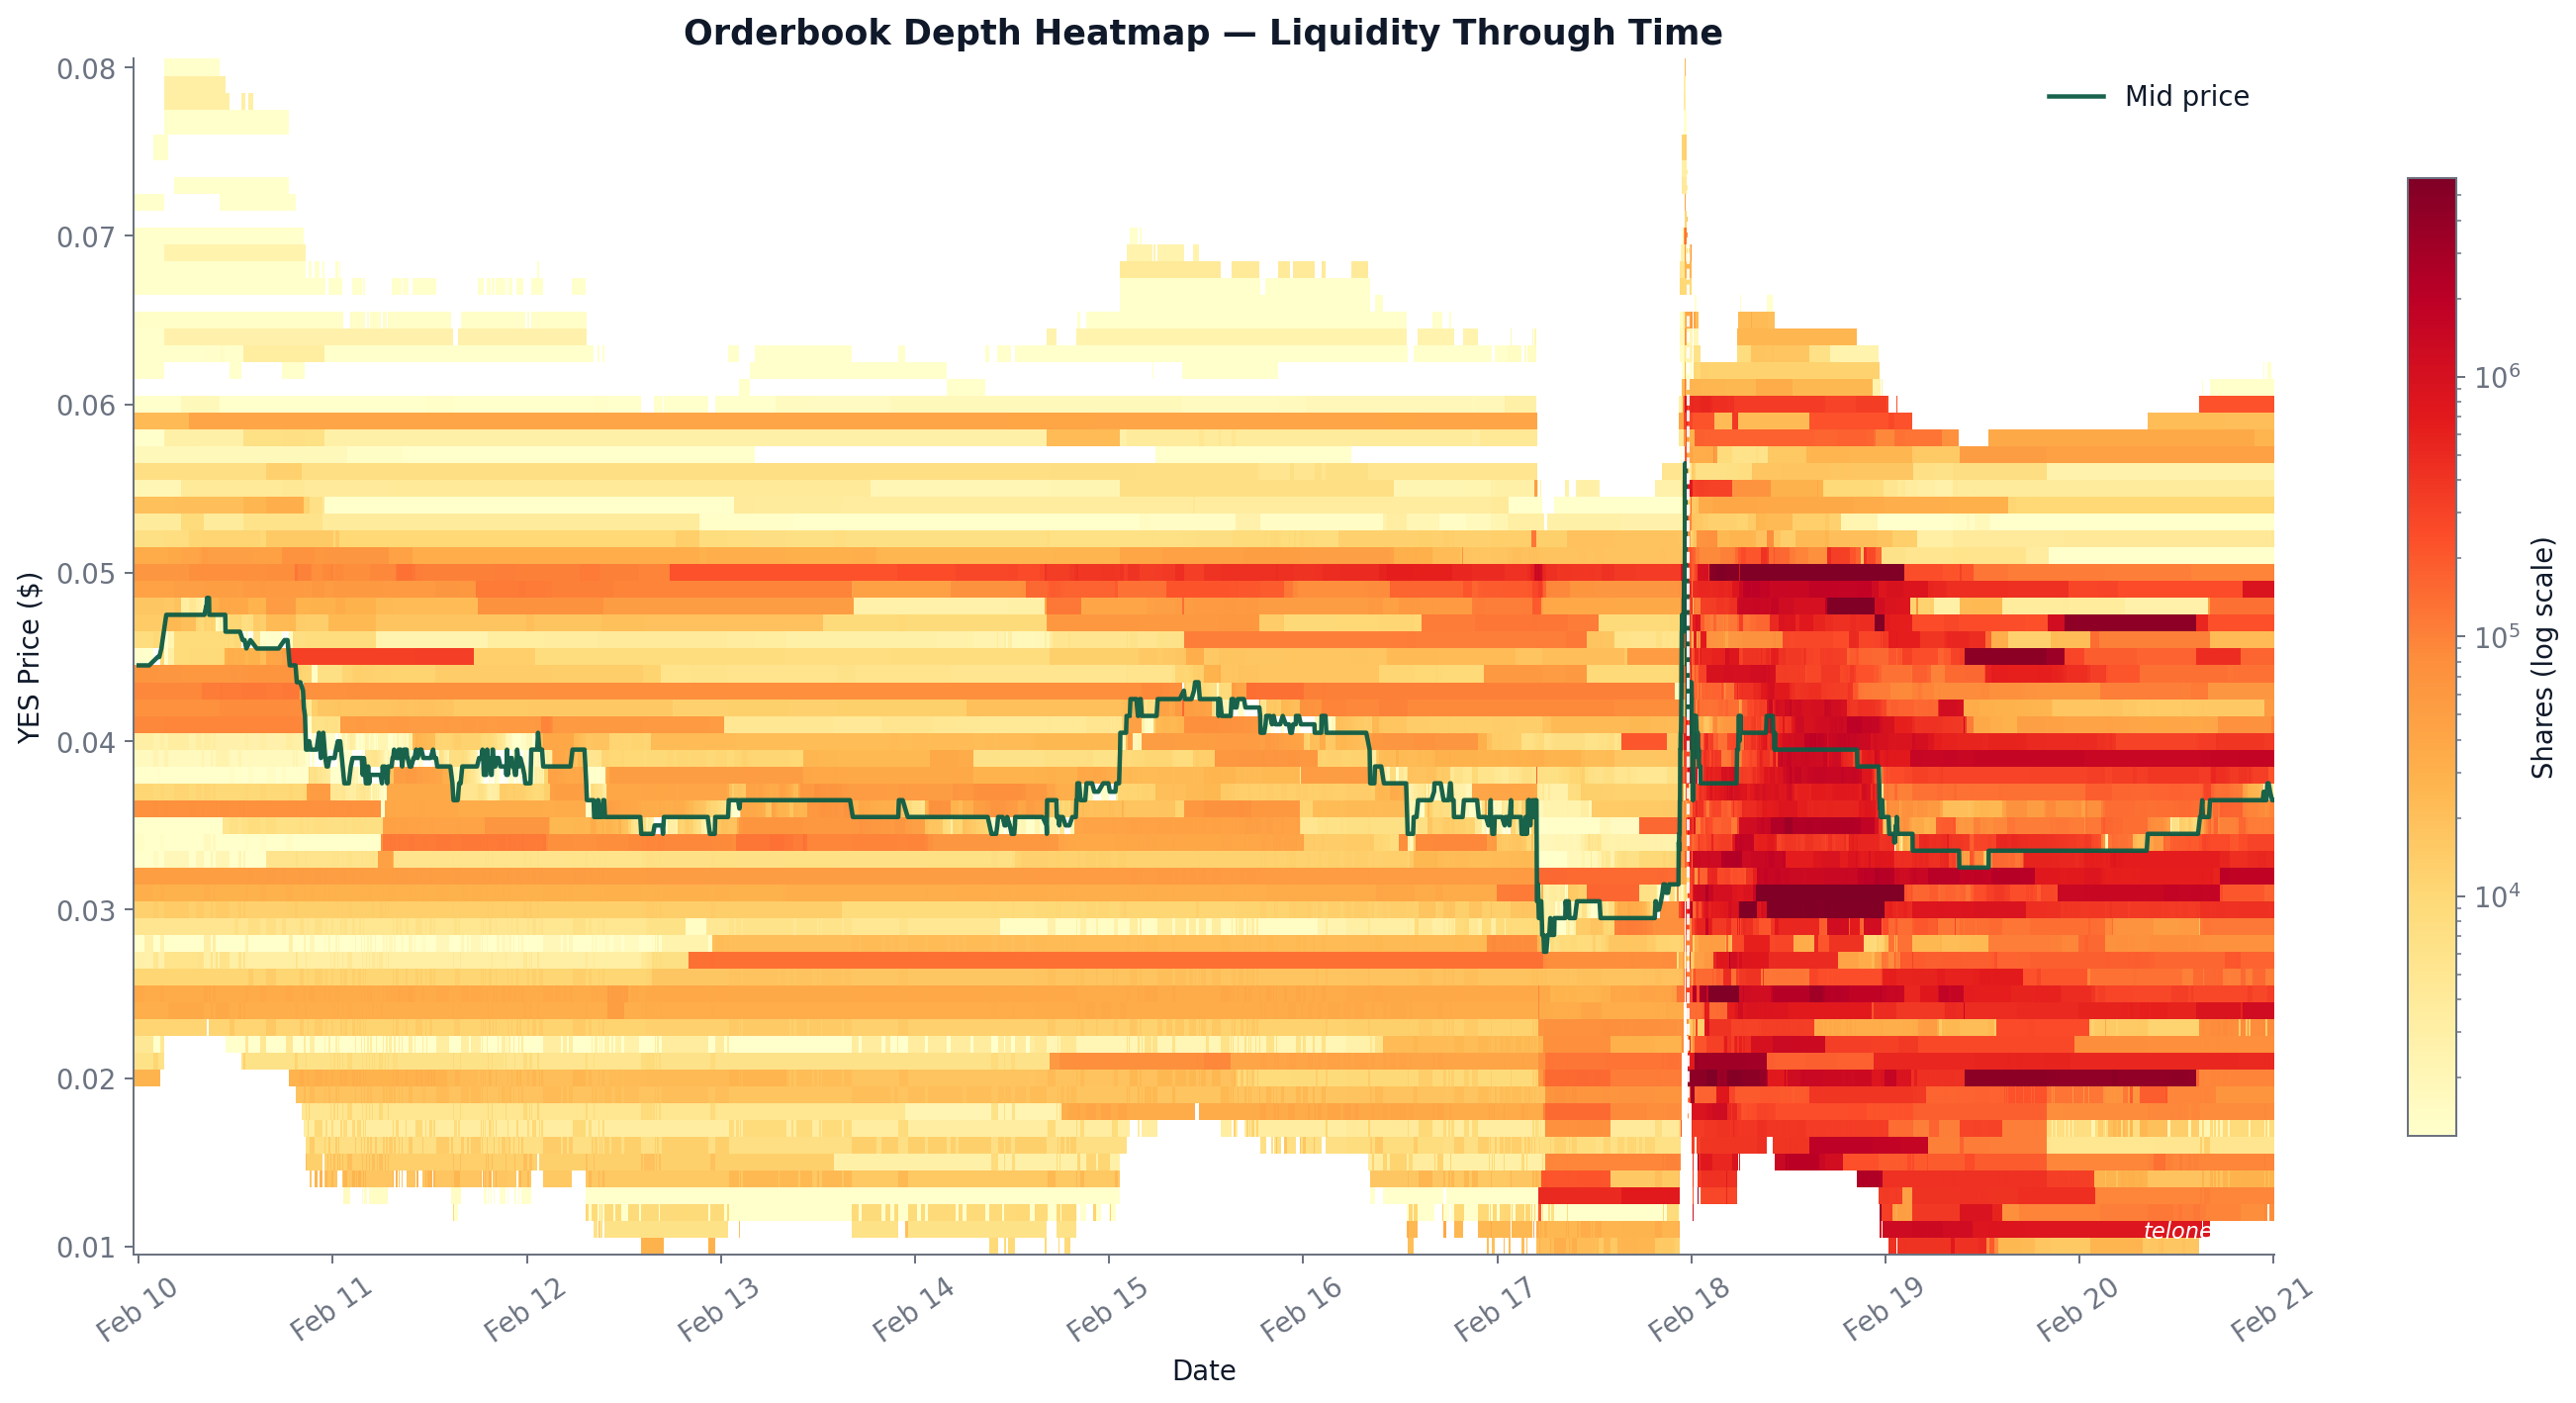
The orderbook heatmap tells the same story from a different angle - here you can see depth across price levels over time, with the mid-price overlaid. The post-event regime is unmistakable: a dense wall of liquidity that simply did not exist before.
What changed: depth exploded, spread stayed flat
This is the key insight, and it's counterintuitive if you think of liquidity primarily in terms of bid-ask spread.
The spread was already pinned at the minimum tick (~$0.001 median) before sponsorship. Rewards didn't tighten it further - there was nowhere to go. Instead, they did what spread alone can't capture: they made the book thick.
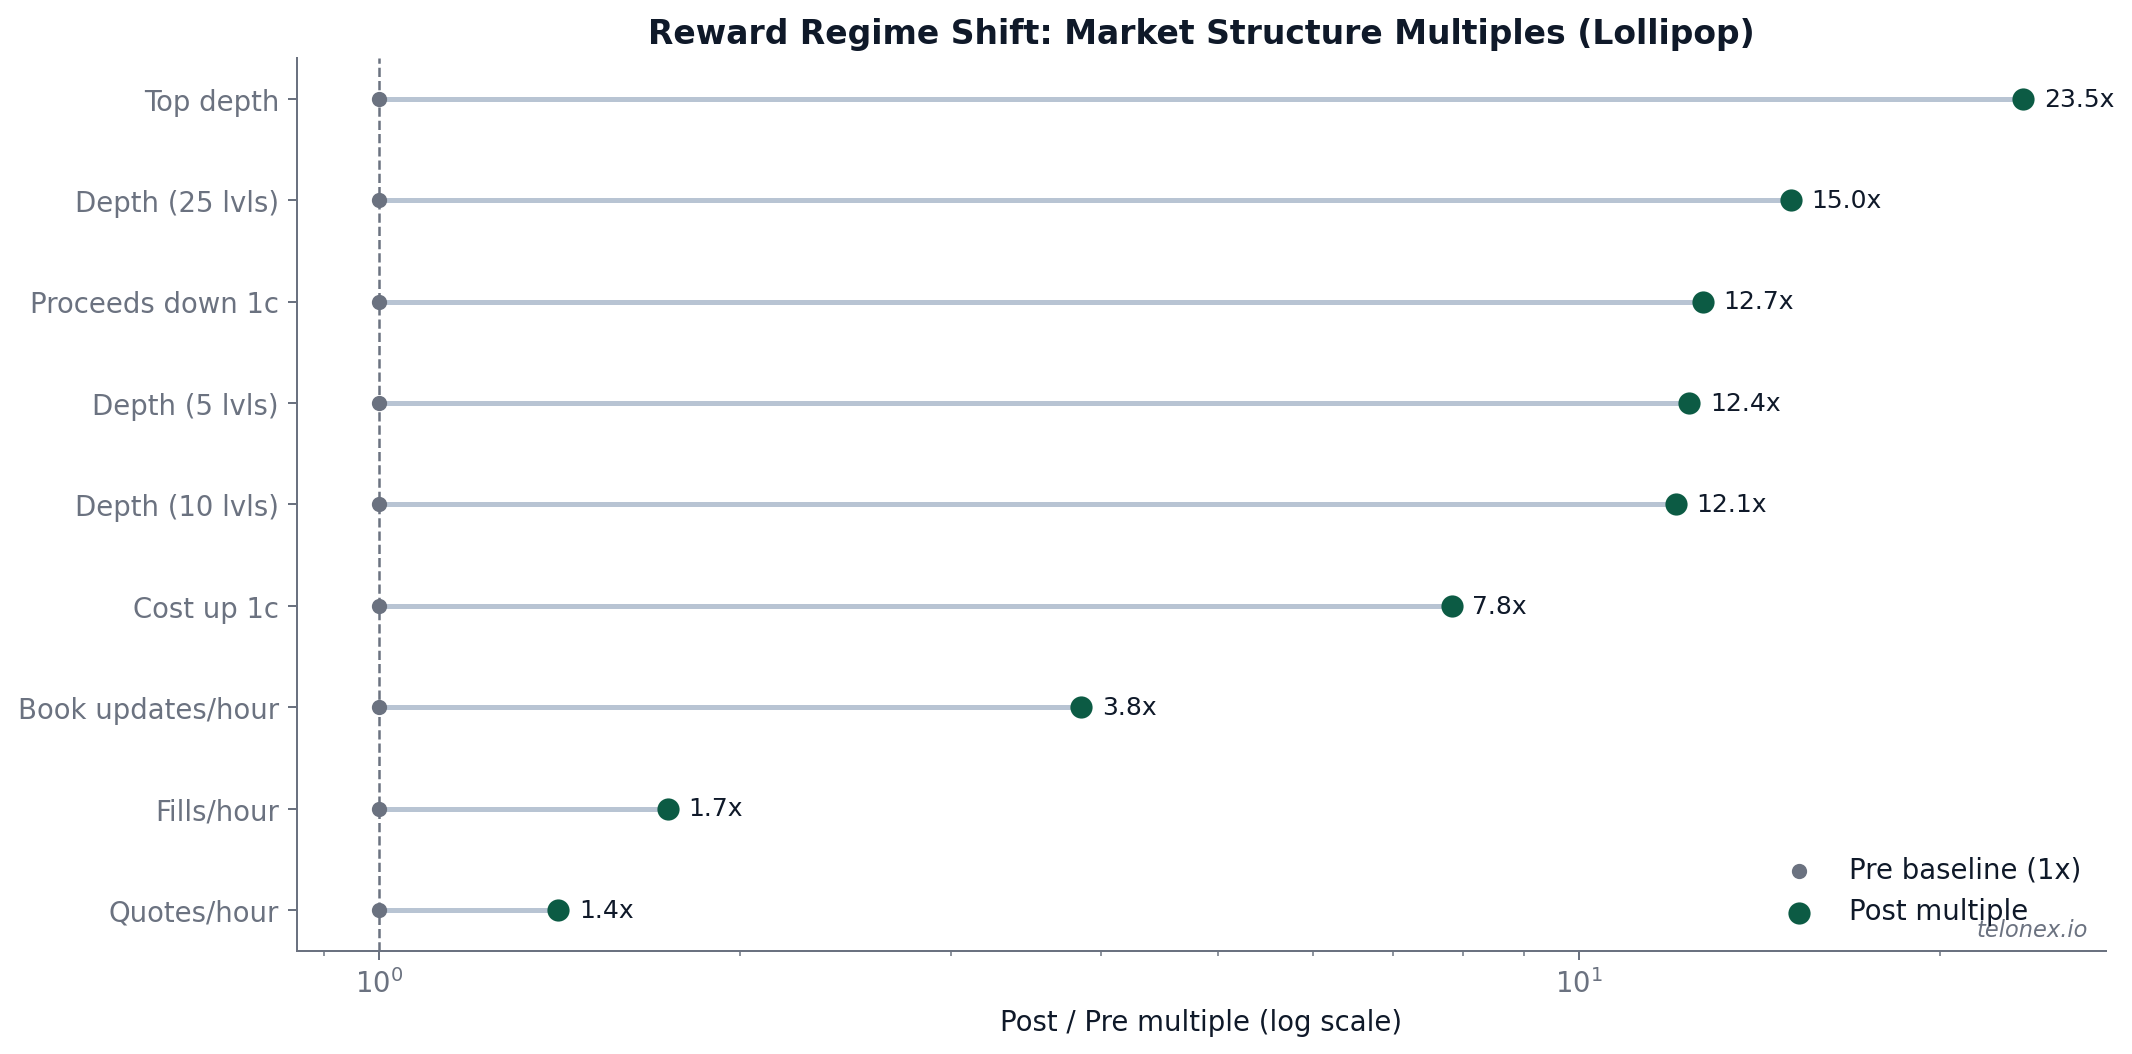
The numbers across the board:
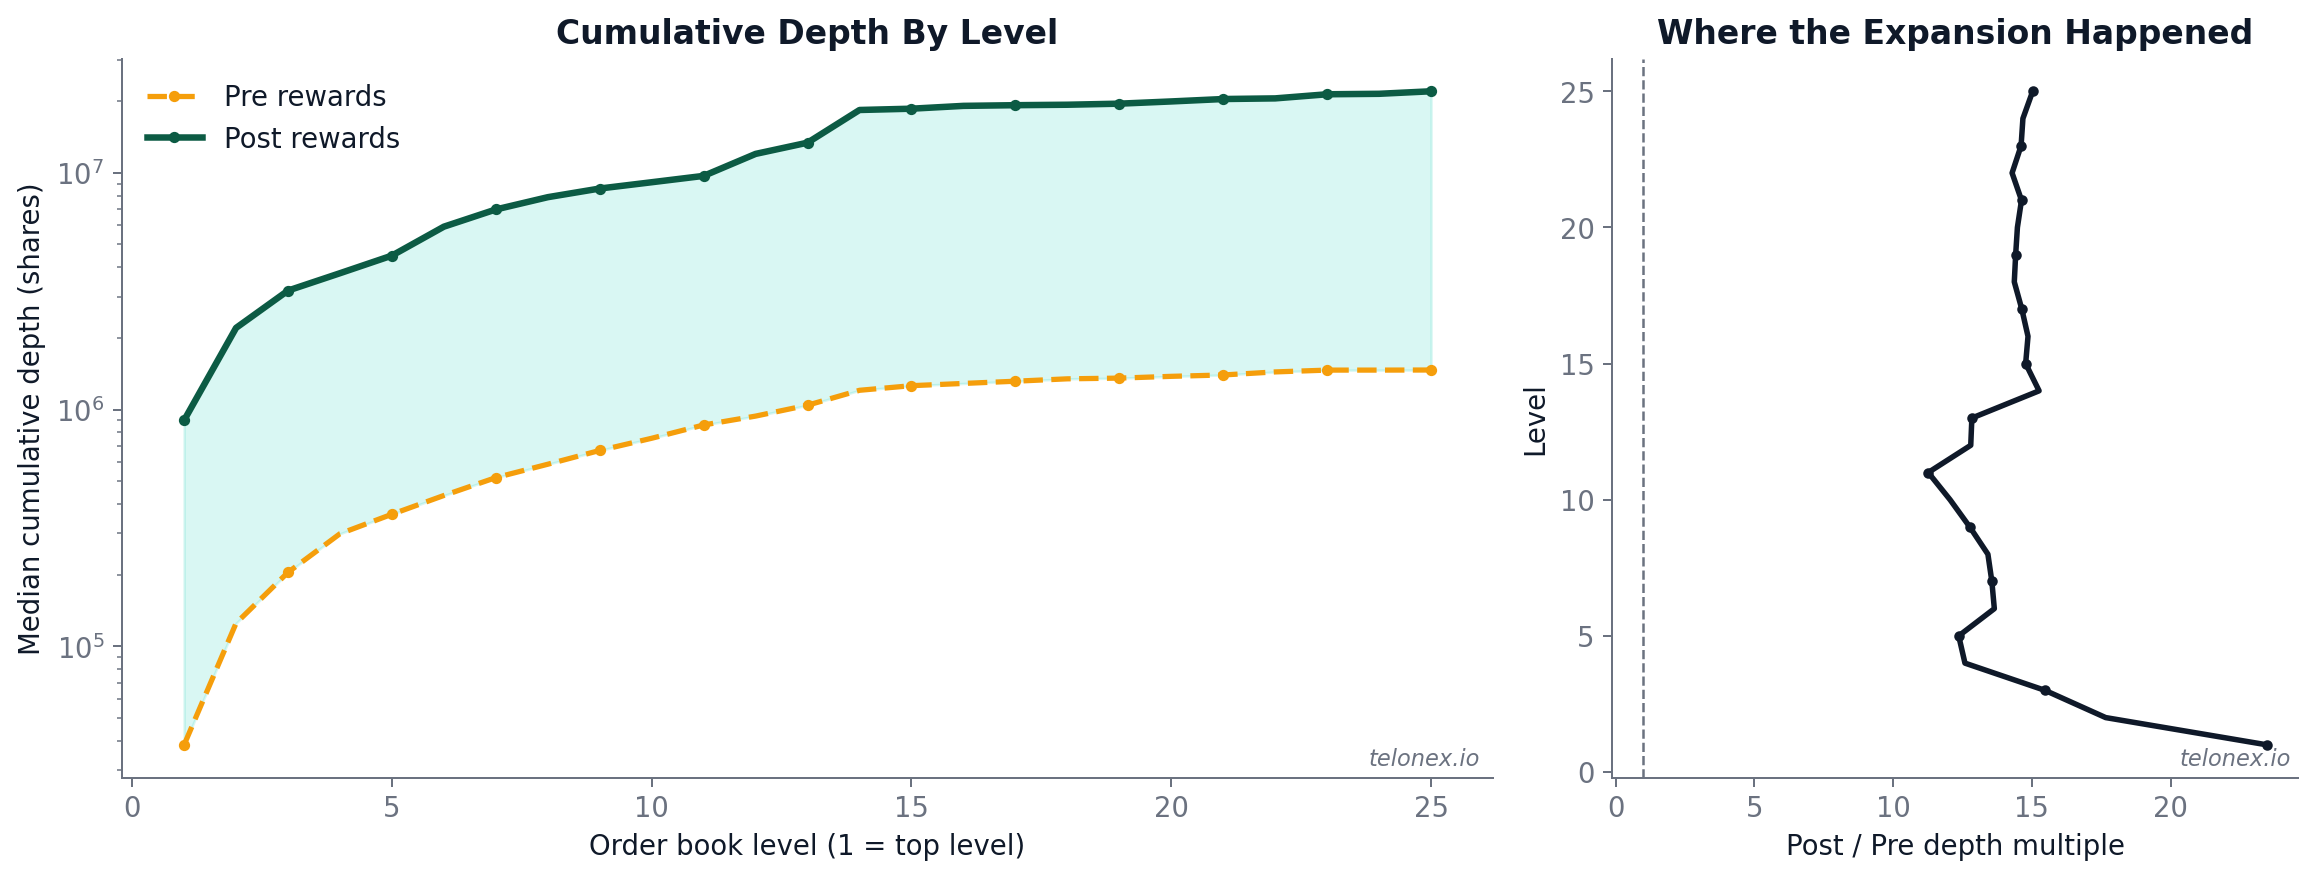
- Top-of-book depth: 23.5x
- Depth across first 5 levels: 12.4x
- Depth across first 25 levels: 15.0x
- Cost to push price up by 1 cent: 7.8x higher
- Cost to push price down by 1 cent: 12.7x higher
This matters for a reason that goes beyond execution quality. In a conviction-driven market like this one, manipulation resistance is critical. Before sponsorship, it was relatively cheap to move the price - a single large order could shift the market and generate misleading headlines. After sponsorship, doing so became an order of magnitude more expensive. The market became harder to manipulate precisely because it became deeper.
Price impact collapsed
Depth on its own is a static measure - it tells you what's on the book right now. A more dynamic measure is flow-impact lambda: how many basis points does the mid-price move per unit of signed taker flow over a given time horizon? Lower lambda means takers can execute without moving the market as much.
- At a 5-second horizon, lambda was essentially unchanged (pre/post ratio of ~1.1x)
- At a 60-second horizon, lambda fell by over 5x
The contrast between these two horizons is telling. At 5 seconds, aggressive orders still eat through the top of the book regardless of regime - the immediate impact barely changed. But at 60 seconds, the post-reward market recovered dramatically faster. Makers were actively replenishing consumed liquidity instead of pulling quotes and waiting.
This is confirmed by looking at large-trade resilience directly: the share of large trades where top-of-book depth was fully replenished within 30 seconds went from 27.3% pre-event to 49.9% post-event. Makers weren't just posting more size - they were refilling faster after getting hit.
Execution quality: how much better could you actually trade?
The ultimate test of liquidity improvement is whether real orders get better fills. We measured execution quality by simulating market orders at various USDC budget sizes against the orderbook snapshots, computing the volume-weighted average price (VWAP) for both YES and NO buys.
NO-side execution is derived from the mirrored YES book (see Methodology).
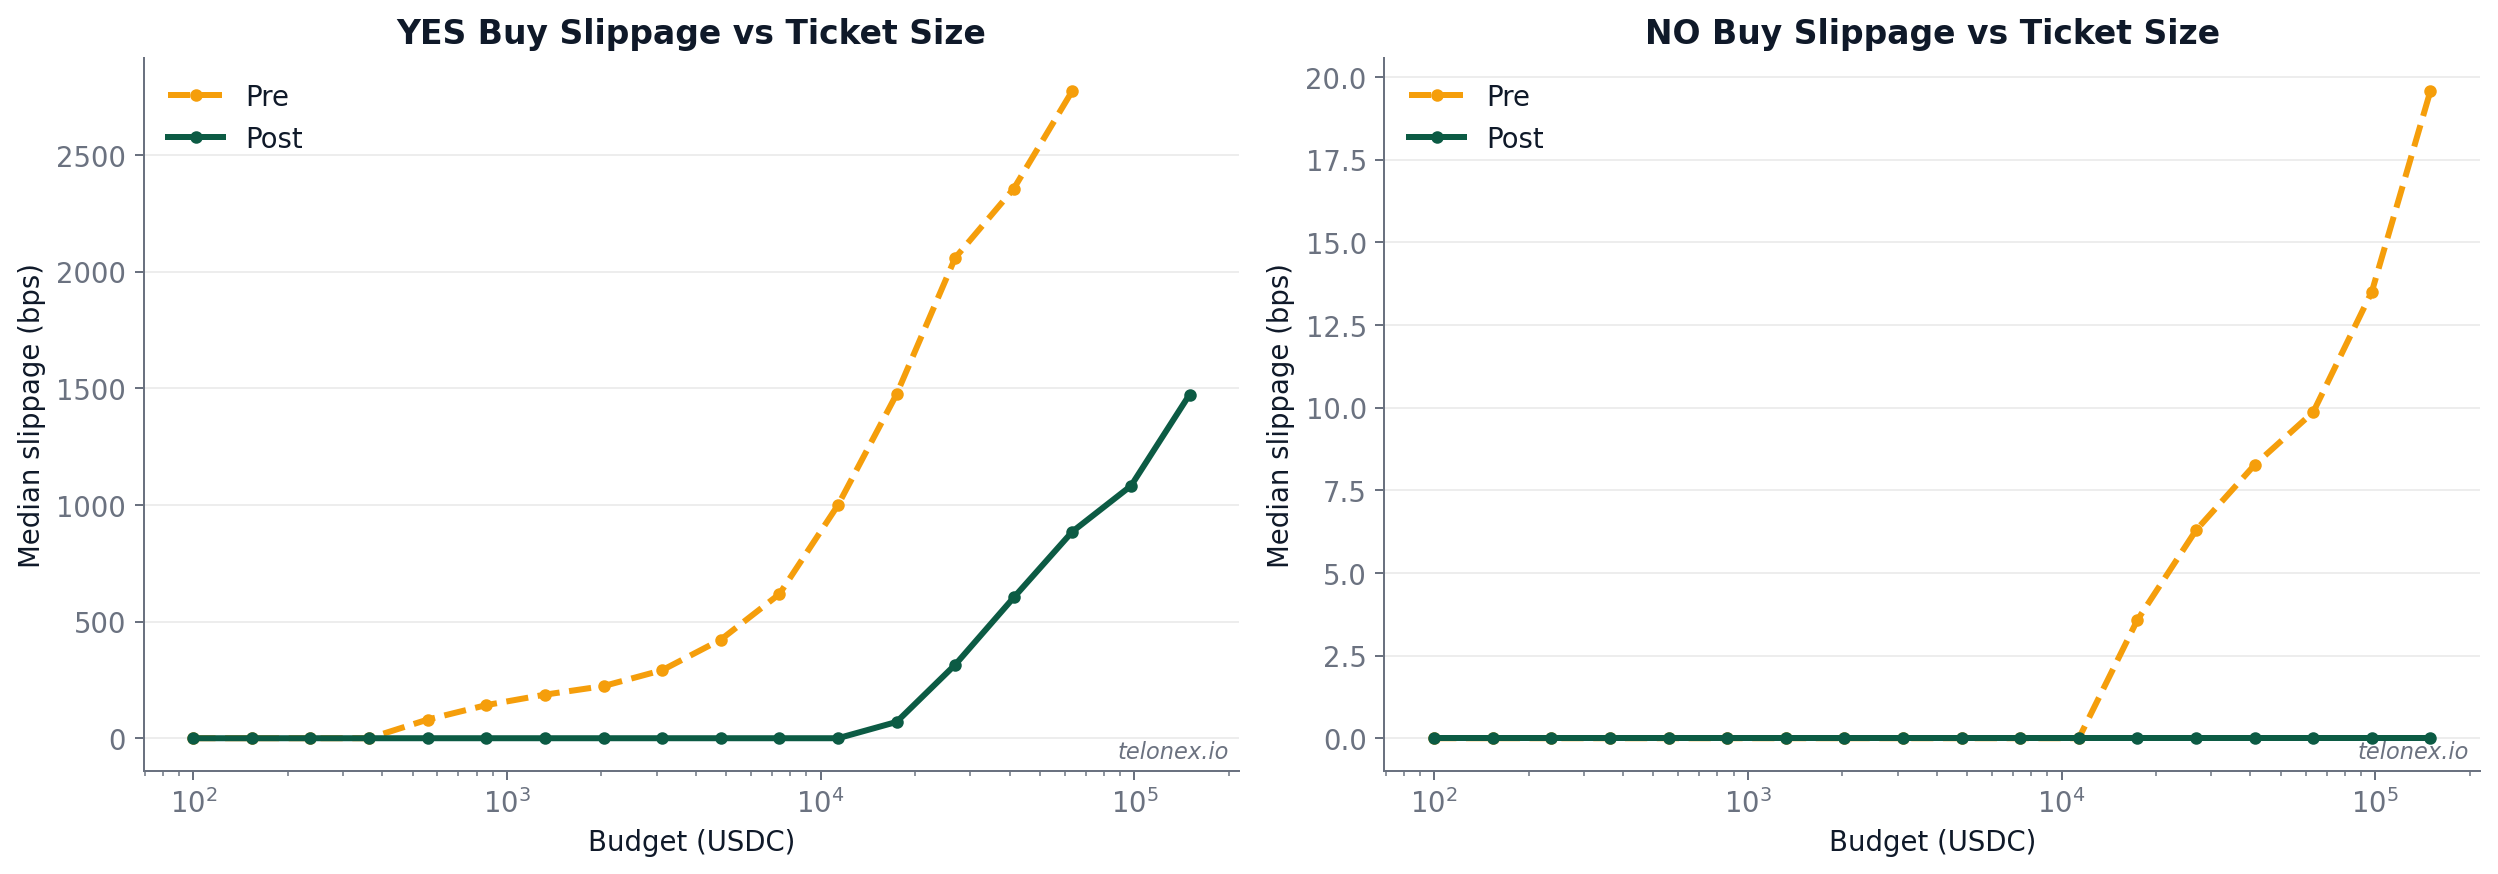
At the $100k ticket size, the transformation is stark. Before sponsorship, a $100k YES buy was only executable in 4.3% of orderbook snapshots - the book simply didn't have enough depth most of the time. After sponsorship, that jumped to 100%. When a $100k YES buy was fillable pre-event, slippage ran around 1,156 bps - but that number only reflects the rare moments of elevated liquidity, not typical conditions.
On the NO side (the skeptic's bet, and the dominant side of this market), execution became essentially free at any size up to $100k - slippage went from 14 bps to zero. YES-side slippage remained elevated for large tickets because YES shares traded at very low absolute prices (around 3-4 cents), meaning even modest price movement translates to large percentage slippage.
For anyone looking to express a conviction-sized position in this market, the post-reward book was a fundamentally different venue.
Maker competition intensified
Sponsored rewards don't just attract more depth - they attract more makers. And more makers means more competition, which benefits takers.
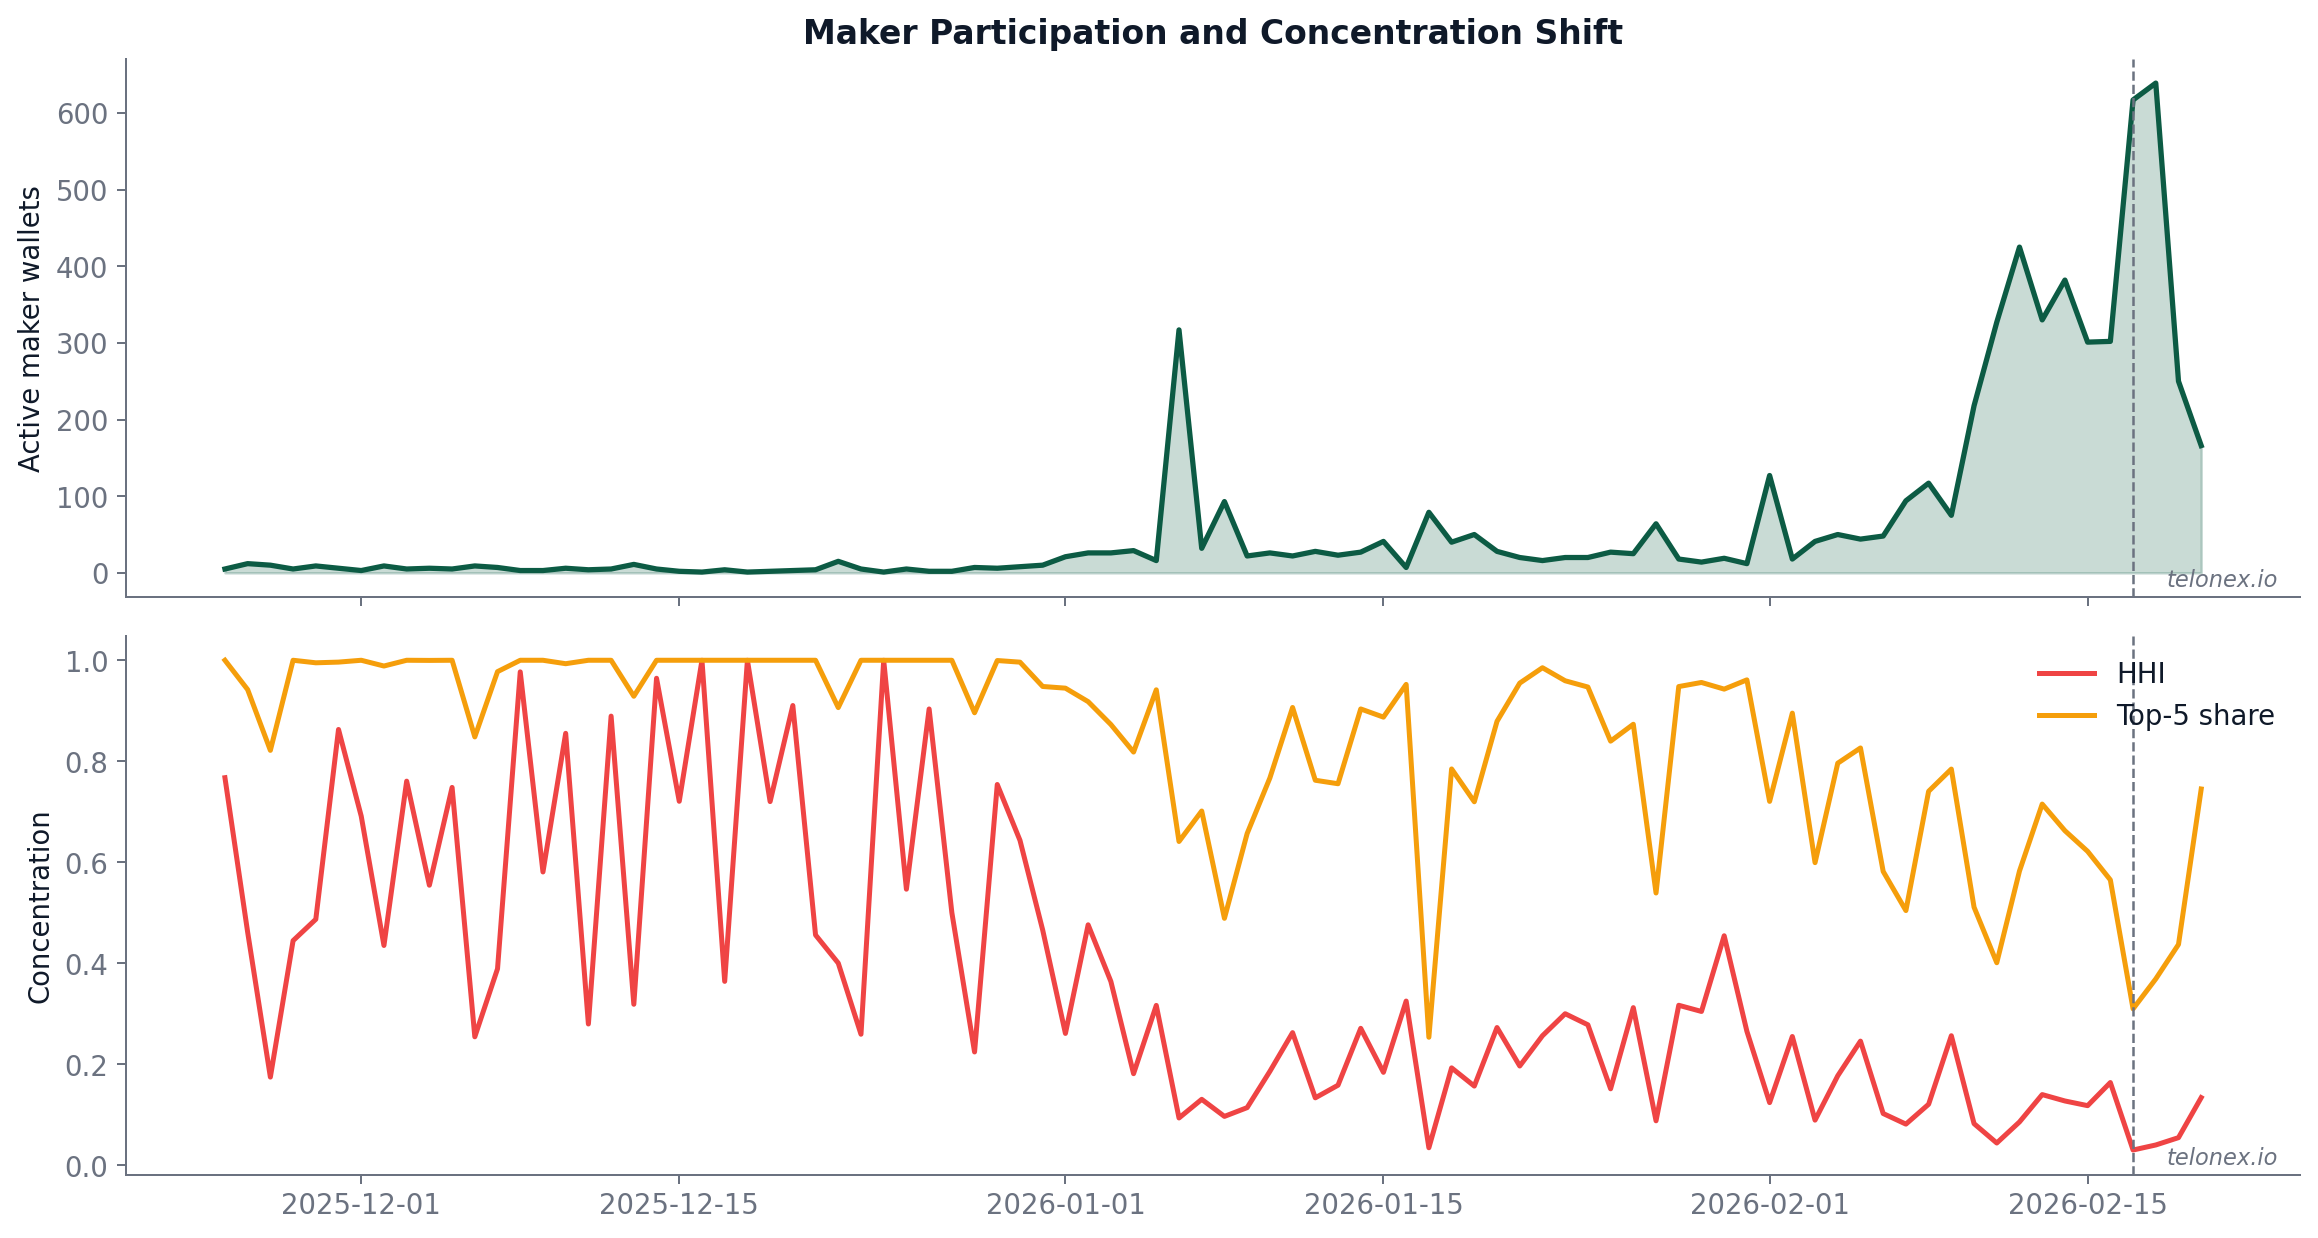
We tracked maker concentration using the Herfindahl-Hirschman Index (HHI) - a standard measure of market concentration where lower values mean more competitive markets - alongside the share of volume captured by the top 5 makers.
| Metric | Feb 16 (pre-reward) | Feb 18 (post-reward) |
|---|---|---|
| Maker HHI | 0.164 | 0.041 |
| Top-5 maker share | 56.5% | 36.9% |
| Active makers | 302 | 639 |
The HHI dropped 4x, the top-5 share fell by 20 percentage points, and the number of active makers more than doubled. This is the opposite of what you might naively expect: you could imagine rewards being captured by a few dominant market makers who crowd everyone else out. Instead, the reward pool attracted new entrants and redistributed flow. The pie got bigger and was split more evenly.
New wallets surged, but with weaker edge
The sponsorship event didn't just change market structure - it changed who was trading. The market was already attracting hundreds of new wallets daily by mid-February. On February 18, 987 new wallets appeared - consistent with the ongoing surge, but now entering a structurally different market.
But more participation doesn't always mean better participation. When we split wallets into cohorts - those active before Feb 17 vs. those who arrived on Feb 18 - the quality gap is clear:
- Pre-event cohort median marked PnL: +$30.10, with 65.6% of wallets in profit
- Feb 18 cohort median marked PnL: +$7.52, with 56.6% of wallets in profit
The new wave was still net-positive on average (this is a market where NO was the right bet and it was easy to express), but the edge was thinner. This is a pattern worth watching in future sponsored markets: rewards attract attention, attention attracts participants, but the marginal participant tends to be less sophisticated than the incumbent.
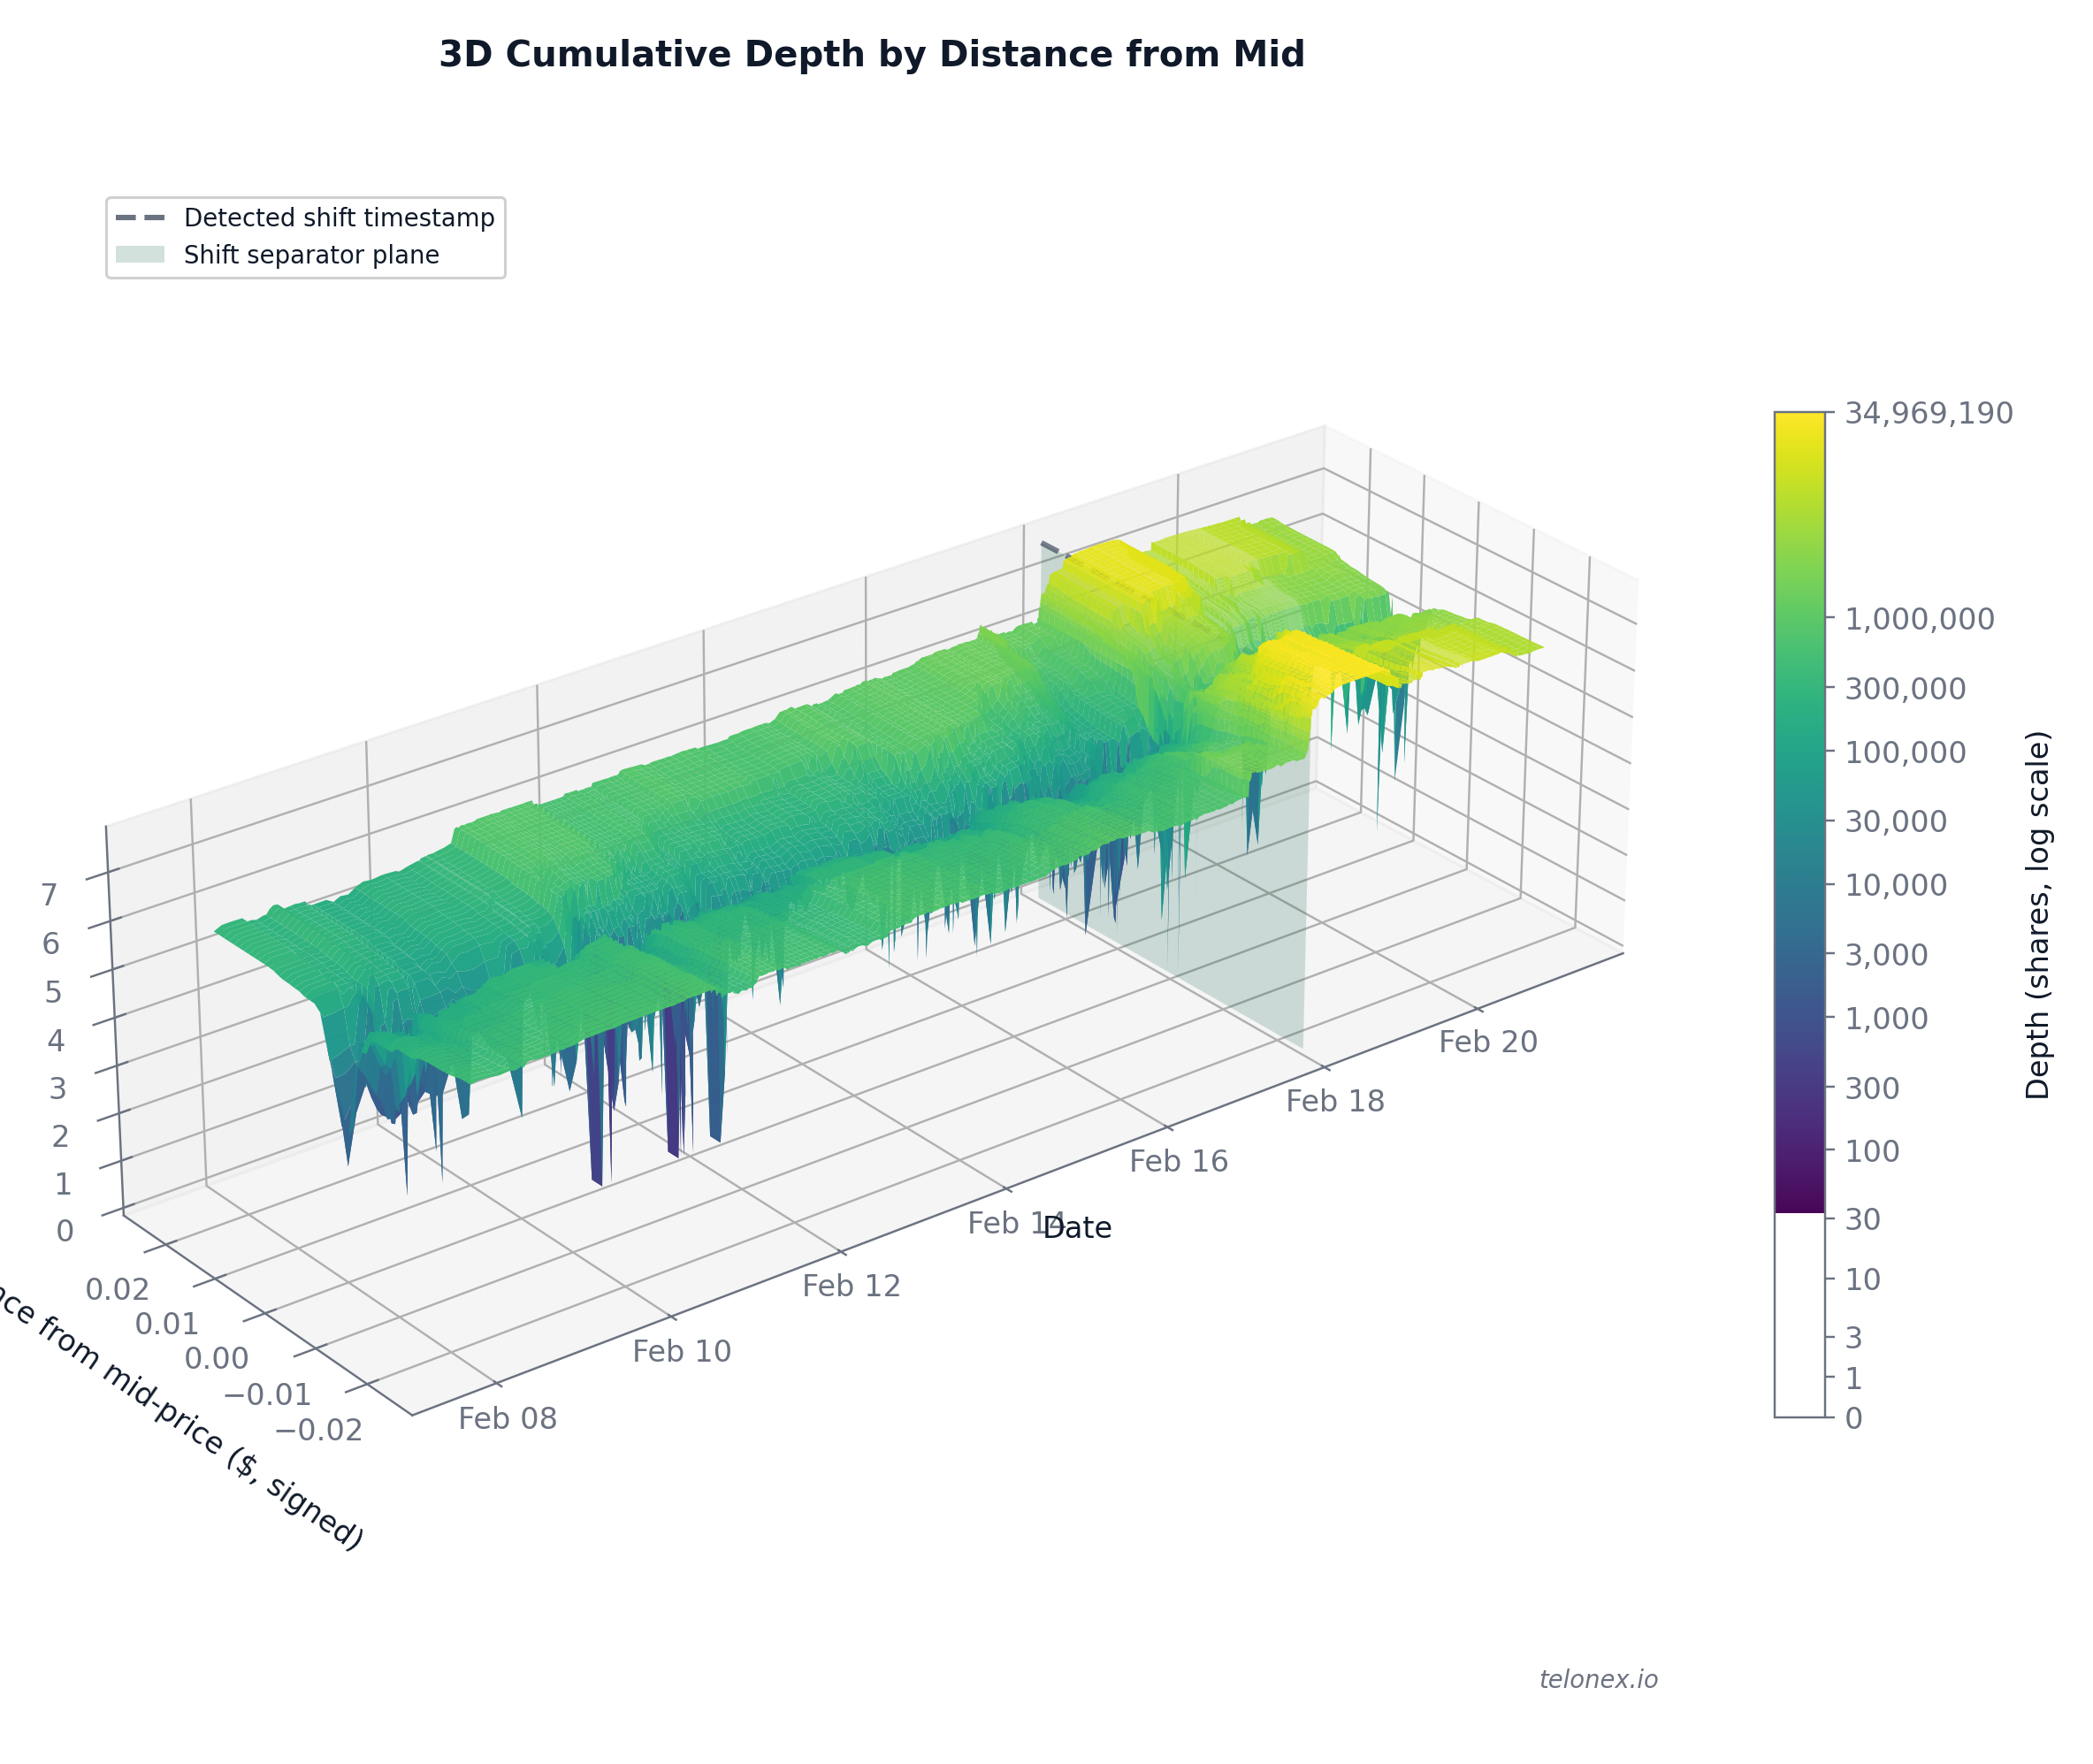
The full picture
The charts above slice the data one dimension at a time. Here's everything at once: the full orderbook depth surface in three dimensions - time on one axis, distance from mid-price on another, and cumulative depth on the vertical axis. The Feb 17 structural break is visible as a sharp ridge where the surface abruptly lifts to a new plateau. What the flat charts show as a step-change, the surface reveals as a transformation across the entire price spectrum simultaneously.
What this means for prediction markets
The Jesus market is a single case study, but the mechanism it demonstrates is general. Sponsored liquidity rewards are a tool for market operators and stakeholders to improve market quality on demand. The results here show exactly what that looks like in practice:
- Spread is not the bottleneck. In markets where the spread is already at the tick floor, the constraint is depth. Rewards addressed the actual bottleneck.
- Maker response was immediate. The structural break happened in seconds, not days. Professional market makers monitor reward pools and respond to new incentives in real time.
- Competition increased. Rewards didn't entrench incumbents. They attracted new makers and reduced concentration.
- Execution improved at the sizes that matter. A $100k order going from fillable 4% of the time to 100% of the time is the difference between a market that's tradeable in theory and one that's tradeable in practice.
- Resilience improved. The market didn't just get deeper - it started recovering faster after large trades. This is the hardest thing to buy and the most valuable for sustained market quality.
For anyone building, operating, or trading on prediction markets, this is the metric stack that matters: depth, price impact, resilience, and executable size - not just quoted spread.
Methodology
We used four Telonex datasets: onchain_fills (Nov 25, 2025 - Feb 20, 2026), trades, quotes, and book_snapshot_25 (Jan 19 - Feb 20, 2026). The structural break was identified as the largest tick-to-tick depth jump on Feb 17. Pre-event window: Feb 10 through the break timestamp. Post-event window: Feb 18-20.
Execution quality is measured as VWAP slippage in basis points, computed against the displayed 25 levels. NO-side execution is derived from the mirrored YES book (NO ask = 1.0 - YES bid). All volume figures are gross taker-paid notional in USDC. Onchain fills on Feb 20 cover 19 of 24 hours; per-minute metrics use active-minute normalization to avoid partial-day bias.
All data and charts in this article are generated from Telonex's prediction market datasets. The full analysis notebook is reproducible.
- Full notebook on GitHub - all code, charts, and queries
- Sign up for Telonex - free tier to get started
- Documentation - dataset schemas, SDK reference, and API docs